Thought we were dead? No such luck...we became embroiled in so much "film intrigue" beginning in late July of 2016 that we were dead to the world as far as baseball was concerned...though we watched the Cubs break their jinx via much good play and many fortunate breaks--winning, in fact, in spite of Joe Maddon turning into the usual post-season caricature that one would have thought he (of all people) might have avoided.
Just as we were getting ready to bring the BBB blog back into something resembling live action, however, another twist of fate roiled into play. We called it the "trifecta"--you are more likely to call it triple bypass surgery. (Yes, the man who adamantly, stubbornly, even absurdly demands more triples in baseball wound up with the biggest "triple" of his life.)
The chest pain had manifested itself a few times before a friend convinced us to visit the ER in late March. One thing led to another--the cath test, where they give you silly drugs and run a tube from your wrist into your heart to look for arterial blockage, showed that there was too much "clog" to avoid the riverdance of full bypass surgery. After a weekend of addressing every detail in every worst-case scenario, we were wheeled up to the top floor of Santa Barbara's Cottage Hospital, where a jaunty crew met us at the crack of dawn.
They didn't give us any time to think about the consequences of failure, though it cannot help but reside in the silent recesses of one's mind. What we knew was that if we made it, we would slowly and strangely emerge from the fog of anesthesia into what we might first mistake for an ante-room of Hell but that in some amount of short order would be recognized as the Intensive Care Unit.
And that's just exactly what happened. One eye opened to a haze of lights and a fractured perspective; voices of unseen people were ladled with a weird vibrato. Then, in what seemed like just a few minutes but was in actuality more than a half hour, the other eye came back online, and sound was suddenly the way it had been before we'd been pumped full of enough stuff to stay underneath all forms of radar for the four hours needed to fix things and keep them from falling apart.
So--a month later, we remembered that some people might actually want some of this type of recalcitrant commentary--even in a time of resistance to the infinite cruelty of those who would make America a plantation again. And it would be a pleasure, in fact, to be that blissfully irrelevant--even if only occasionally.
With that, we remind you of our most intriguing discovery in the past several years--the data lurking in the shadows of Forman et fils pitching breakouts--what they call "non-save situations." (You can search through the maze of past posts to get re-acquainted with the particulars of all this, but suffice it to say it's the games where teams are tied with their opponents or behind--situations that have no "save" or "hold" component, that fit into this category.)
You might remember that these games produce an aggregate .560 WPCT for teams, belying the idea that everything in baseball is a zero sum proposition. But what you probably don't remember is that the distribution of these WPCTs clearly show that the teams who do better than average in winning games from such situations are the ones who go to the post-season.
Here's today's stat takeaway: from 2000-2016, teams that failed to make the playoffs had an aggregate .543 WPCT in non-save decisions.
Whereas teams that made the playoffs had--wait for it--a .625 WPCT in those same situations.
This is the greatest distance between "haves" (playoff teams) and "have-nots" (also-rans) in baseball history. (Could it be that this is related to the general rising inequality in America? Or are we just stretching things too far because we can?)
At any rate, you'd be well-advised to follow this split in Forman et fils Play Index. We'll update it periodically during the 2017 season--when we have time (we're still working on a non-baseball book and, trust us, it's a beast).
Sunday, July 31, 2016
Friday, July 29, 2016
HITTERS OVER THE PAST 365 DAYS
Courtesy of David Pinto's Day-by-Day Database at Baseball Musings. Former MVPs in blue.
Here are the top guys...

Former MVPs in blue. David Ortiz plans to retire? Jeez.
Next tier...

Adrian Beltre looks like he will hang in to get 3000 hits. After he and Iricho! do it, however, it will be a long while before anyone else does it...
Third tier...

You can see how recent NL MVPs (Buster Posey and Andrew McCutchen) have declined...they have some work to do in the second half of 2016 to help their teams make the post-season.
Here are the top guys...

Next tier...

Adrian Beltre looks like he will hang in to get 3000 hits. After he and Iricho! do it, however, it will be a long while before anyone else does it...
Third tier...

You can see how recent NL MVPs (Buster Posey and Andrew McCutchen) have declined...they have some work to do in the second half of 2016 to help their teams make the post-season.
Thursday, July 14, 2016
2016: COMPLETE GAMES #39-42
 Updating the ever-ongoing CG chase to oblivion...
Ten days passed (from 6/25 to 7/5) between CGs 38 and 39.
 The CG count at the All-Star Break: 42, nine behind the 2015 pace, a year that saw CGs dwindle down to exactly 100.
It's looking more and more likely that we will see CGs drop into double figures this season.
The team emerging as the practitioner of the CG: the San Francisco Giants, who now have eight (8!) complete games for the season. (And it's only July!)
Pitcher won-loss records in CGs remains quite high: 37-5 (.881)...compared with .780 (78-22) in 2015. Overall ERA for 2016 CGs is 0.72, as opposed to 0.92 last year. Last season there were 9 CGs with at least 4 runs allowed; thus far in 2016, that total is...zero.
Wednesday, July 13, 2016
TOTS GETTING TATERED IN CINCY--A NEW HR RECORD ABORNING??
We all too often focus on baseball's offensive statistics from the point of view of the offense...which is natural, because the offense is what drives run-scoring. But we don't often look at the offensive stats that accrue from what opposing batters do versus the collective pitching staffs of individual teams.
 For example, many people knew for years that the 1961 Yankees set a new team HR record. There were three reasons for this, in order of significance: Mickey Mantle, Roger Maris, and the fact that the new record (240 HRs) was a nice round number.
But ask folks what team's pitching staff has surrendered the most HRs in a season and you will receive the "catwalk stare"--that blank look that runway models have brought to "perfection" as they avoid eye contact while making eye contact...
Hell, even we didn't know the answer. (But we promise that our stare will be "gimlet-eyed" at the very least.)
Before we reveal it, however, let's go on record with the fact that it's a record in grave danger of being shattered in 2016. If you've read the posts further below, you know that HRs are currently spiking, bringing us back to HR/G levels not seen since the early days of the 1990s offensive explosion.
And while investigating that trend, we stumbled onto the "Batting Against" statistics at Forman et fils and proceeded to watch our eyes pop when we saw that the Cincinnati Reds had already given up 154 HRs in the first 89 games of the 2016 season.
That rate extrapolates out to a staggering total of 280 HRs, which was characterized above as "shattering" the current record.
The current record for HRs allowed by a team is 241, which was set by the 1996 Detroit Tigers. (The team record for hitting homers has evolved up to 264, set by the 1997 Seattle Mariners, and there has always been a bit of a "lag" in the "homers allowed" stat.)
 But those Reds look to be breezing their way to a total that will surpass that. We checked to see if this might be due to a series of short-term performers on the Cincinnati pitching staff who gave up some mind-boggling number of HRs before being sent to the back to the minors--one pitcher (Jon Moscot) fits that description, having allowed 10 HRs in just 21 1/3 innings. And Alfredo Simon, an established starter for the past several years who's currently sporting a 9.85 ERA, has also been prone to the long ball: 14 HRs in 53 IP.
That might seem to mitigate the Reds' chances a bit, but we also checked the HR/G rate in the first part of July, when neither of these estimable gentlemen were active--and they are still giving up taters at an elevated rate: 20 in the past ten games.
So this is going to be very interesting to track as the Reds' abysmal season plays out. (And poor overall performance, rather unsurprisingly, goes hand-in-hand with giving up carloads of HRs. Of the 71 teams that have allowed 200+ HRs, only 13 have managed to play at least .500 ball while doing so.)
Stay tuned...
Wednesday, July 6, 2016
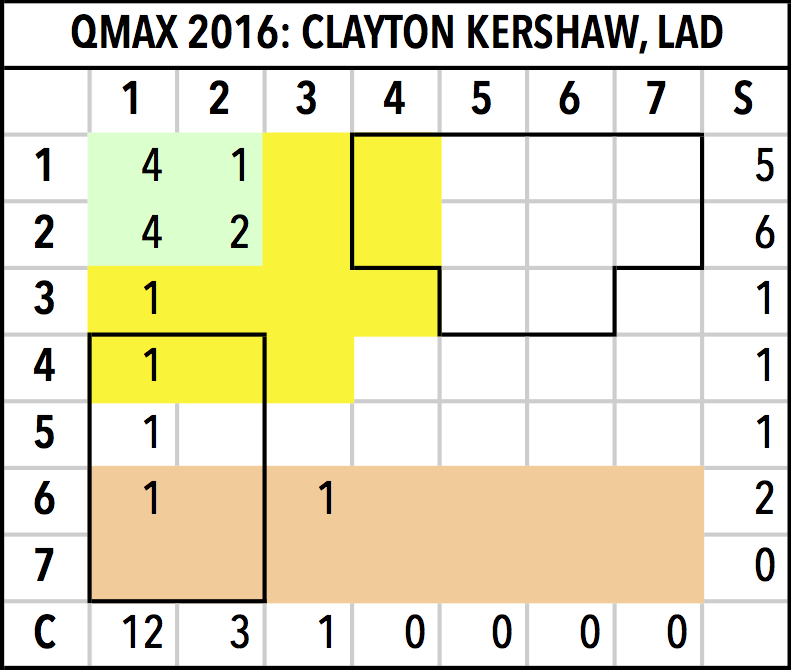
2016: QMAX COMP...KERSHAW v. ARRIETA
Too bad that Clayton Kershaw is down indefinitely with back miseries, it would have been interesting to see just how his terrific start in 2016 would have played out with a full set of starts.
 The Quality Matrix had "the Claw" as a sub-4 pitcher through his first 16 GS (2.56 "S," 1.31 "C", 3.87 "T"). His QMAX matrix chart was free of anything to the right of a "2C" game until his last start (when the injury surfaced).
His QWP (QMAX Win Pct), built from the probabilistic won-loss from each of the 49 sectors in the QMAX matrix grid, was an excellent but not superhuman .742. The reason it's not hovering closer to .800? You have to really avoid "hit hard" games...Kershaw's 13% is excellent but not superhuman. You've really got to be in single digits with respect to HH to optimize your QWP. (Now there's some jargon for the ages...)
 Jake Arrieta is showing some slippage in comparison with last year's CYA form. Over his first nine starts, his ERA was 1.29--a good bit lower than what even his QMAX scores to that point (2.33 "S," 2.89 "C") would have projected...but these numbers were still close to his overall numbers in 2015.
In his last eight starts, however, Jake's control has gotten shakier and he's become a good bit more hittable...his ERA over this span is 3.79 and the QMAX totals (3.75 "S," 3.75 "C") have been bringing him back toward earth. Overall, his BB/9 is close to double what it was in 2015.
Jake's QWP over his first 17 GS in '16 is a solid but not great .650. His hit prevention is still very good (3.00 "S"), but as his QMAX matrix chart indicates, he's gotten a good bit more erratic.
Monday, July 4, 2016
DICK ALLEN REDUX, OR: SOME SHOULD TAKE THE FIFTH ON THE FOURTH...
 In a perpetual party-hearty world of desperate iconoclastic conformity, where so many seem in the grip of an intellectual poverty draped in the Bible and the American flag, we come to the fourth of July in this year of mock-fear and silicone-implant trembling, and find ourselves squarely in that darkling plain where the old, otherworldly poet is supposed to intervene before the pure products of America go crazy.
 And, man oh man, does all of that strung-out syntax bring us crashing back to Dick Allen, who contains more multitudes than William Carlos Williams' siren call or a universe full of Whitman's samplers--a man who discovered, like our outgoing president, that backlash is more powerful, more relentless, more festering than any force in the dark heart of white America.
Dick Allen did not bear his burdens with grace while he was playing baseball, and that--and the impact of the backlash that imprinted itself on his brilliant but mercurial career--is why he remains an outsider to this day, both in terms of the world at large and in the tiny circle of faux-meritocracy that we clench our throats to call the Baseball Hall of Fame.
Baseball had the healing moment for the 1960s--that frenetic and foul decade that continues to split the country into shards of hate--in its hands for many, many years. It had a chance for one of the great symbolic moments in its history, simply waiting for--no, not inspiration, but mere common sense. It had two players who represented the polarities of the 1960s, the frenzy and the frustration from all sides, the warp and the woof in that tensed canvas of a history that so many have since taken in vain.

The game didn't come easily for Santo--while he was a difficult, daunting personality, he was driven to succeed and arguably overworked himself into a premature exit--one of the reasons that it took so long for him to finally be inducted into the Hall of Fame. Allen, by contrast, made what he did at the plate look easy: he was so good at it, despite imperfect eyesight, that he knew he didn't need to go through what he considered to be the needless rigors of spring training, or pre-game hitting practice. He knew how to marshal his talents, and he kept everyone away from them. Santo kept everyone away by being the most belligerent obsessive-compulsive on any diamond that he inhabited.

Had those words been tempered with mercy and an actual understanding of what was happening in the 60s and 70s, they could have led to the healing event that baseball needed and will never get--the seemingly unimaginable embrace of the Silent Majority and the "Black Maudit." Santo, wheeled onto the dais to give a tear-stained speech about his love of the game and the value of forgiving one's enemies, particularly oneself; Allen, striding with a gingerly grace, admitting that he'd hoped for the honor despite his pose of unwavering indifference and resignation, turning to Santo and saying to him, "Look, Ron, this time we really are teammates...and God bless you."
It should have happened in 2009, the year we installed an African-American in the White House, before he spent too much time trying to appease the forces of white darkness that would look to thwart and hound his every move, and turn back the clock in favor of oligarchy, sexism, and fear-based hate. Those two elderly ballplayers, on the Cooperstown dais on a Sunday not too far removed from the fourth of July, would have told the country that it was finally all right to quit fighting about the 1960s, to put it behind us at last--to let go.

That may be due to the fact that Nathanson often fails to get the flavor of Allen the ballplayer into his narrative. A careful, even-handed recitation of Allen's life as a lightning rod is detailed to a fault, but it rarely brings alive what Allen's presence on a baseball field was like--which was electric in the extreme. In his rush to examine the 1976 season as an example of how Allen could not step away from controversy when it came to management's attitude toward minority players, he undersells Allen's on-field contributions. Pointing out that Allen had only seven home runs in late June, he omits to mention that this total had been amassed in 119 ABs, a ratio that works out to a total of at least 30 HRs over an entire season. He mentions that Allen bristled at being dropped to seventh in the batting order, but he omits the fact that Dick was put back in the fifth slot after hitting .395 in the twelve games he hit from the #7 slot. In short, the world doesn't know (and mostly doesn't want to know) that Allen, when healthy in 1976, was close to his usual self (155 OPS+).
 |
| The man who made it look easy at the plate played hard on the field...maybe too hard: he had more than his share of injuries. |
As we've said many times, the Hall of Fame needs to be as large and inclusive as it can be in order to maximize its own scope and impact--it must reach out to all the people in order to make its message synonymous with the real meaning of the fourth of July, which is not flag-waving and liquor consumption but "life, liberty and the pursuit of happiness." Those who would tamper with others in those latter elemental efforts should find themselves in front of the kangaroo court that they've allowed to be installed in the so-called highest legal institution of the land and be forced to take the Fifth Amendment in response to relentless and protracted questioning.
Thursday, June 30, 2016
2016: A CRISIS IN AL STARTING PITCHING?
The answer to the above question certainly seems to be yes, and it appears to be occurring in the context of an overall resurgence of home runs--with primary emphasis on the AL.
 Here are some salient monthly breakouts in 2016 by league that will show you how this is progressing this year (table at right).
 The June totals indicate that offense, at least in the AL, is not just creeping back, but has flooded the game, pushing offense levels back in the direction of the offensive explosion years. We can measure that in two parallel historical comparisons.
 The heat chart certainly shows how offense slowed down in 2008, and then really took a dive from 2010 through most of 2015. But as you can see, things started to change in August of last year--and, from what we can tell, nobody really picked up on that. This year, we had a slow opening month, but look what's happened since.
 Time will tell if this is just an aberration, such as the one you can see in August 2009, and to a lesser extent in August 2011 and July 2012. But given the movement over the past six monthly data points since August 2015, we're not getting the feeling that this is an aberration.
 Here are some salient monthly breakouts in 2016 by league that will show you how this is progressing this year (table at right).
We were lulled to sleep in April by low BA/OBP totals. But the AL quickly rebounded in May and pushed its HR/PA percentage over 3 (which is the benchmark for what we term a "slugging league").
They upped the ante even more in June, and the NL started to come along for the ride, pushing their HR/PA above 3 as well.
 The June totals indicate that offense, at least in the AL, is not just creeping back, but has flooded the game, pushing offense levels back in the direction of the offensive explosion years. We can measure that in two parallel historical comparisons.
First, here (at left) are the R/G rankings by month for the last 100 months of major league baseball (sixteen years from 2000-2015 plus the first four months of this year--with the caveat that the July 2016, added after our deceptive "post date," is a very small sample).
 The heat chart certainly shows how offense slowed down in 2008, and then really took a dive from 2010 through most of 2015. But as you can see, things started to change in August of last year--and, from what we can tell, nobody really picked up on that. This year, we had a slow opening month, but look what's happened since.
What we can see when we create the same breakout for HR/PA over the last 100 months of baseball (at right) is what is driving this change. It's simple: home runs are up, way up. Most of the gain in the overall HR/G stat in 2015 from the year before seems to have come in a significant uptick in HR frequency in the last two months of the year, and that trend has made an astonishing acceleration as we approach the summer of 2016.
Pretty amazing to see the HR/PA rate in the month just concluded up there with the rates achieved in 2000--the year with the highest R/G average in the history of baseball (not counting the 1890s).
And we can see more clearly how big the jump in HR/PA was in August 2015 and how it is driving this crisis in pitching.
 Time will tell if this is just an aberration, such as the one you can see in August 2009, and to a lesser extent in August 2011 and July 2012. But given the movement over the past six monthly data points since August 2015, we're not getting the feeling that this is an aberration.
As for the crisis in AL starting pitching, here's a simple chart that can put that into perspective. This displays the breakout of starting pitcher ERA in for each of the first three months of the season. Note that in June the bottom falls out of AL starting pitching, with nine of fifteen teams posting ERAs of 5+ for the month. (And that includes the Orioles, who hit 56 HRs--matching the highest monthly total of any team in past 17 yearrs--and averaged .300 for the month, allowing them to have a winning month of June anyway.)
And for what it's worth (small sample alert), the Indians, whose starters bucked the June swoon, have hit a speed bump early in July, including a 17-1 shellacking in which ace Corey Kluber had a ugly outing. That's mostly due to the matchup (Blue Jays) but it points out that offense is back, and it's the long ball that is leading the way. We were complaining about baseball being two-dimensional in recent years, but now we may be seeing its return to one-dimensionality.
Yes indeed, 2016 is shaping up to be quite a year on all fronts...
2016: COMPLETE GAMES #28-#38
What with the phenomenon of starting pitchers "giving ground" performance-wise (see the previous post, being written later...), we really may see the first year in baseball history where the CG total fails to break into triple figures.
 Last year there were 40 CGs going into July, and we wound up with 60 more to wind up with exactly 100 for the season. As we've noted before, there is a tendency for CGs to increase in frequency in the second half of the year, so while the current projection when extrapolated without adjustment suggests around 80 CGs, we expect that number to somewhere between 92-96.
June produced only 12 CGs, as opposed to 20 in May. Parallel with the Indians' late June streak, their starting pitchers were not only pitching extremely well (bucking that trend we reported on earlier, being written later--what can we say: blogs are backwards...) but they were going deep into games like nobody's business (4 CGs for the month, and three in four days).
What else can we say? These CG pitchers this year are really smokin' in terms of hit prevention. Ten out of the eleven most recent CGs have been "1S" games according to QMAX.
Wednesday, June 8, 2016
SANITY (?) PREVAILS IN THE MLB TEAM HOME RUN CHASE...
We were shocked yesterday when we consulted the general major league stats/standings and discovered what team was leading in home runs...
No, not the Braves, who probably won't hit as many all season as this team has hit in just 56 games (now 57...time keeps passing, you know?).
To keep this semi-suspenseful for those of you who don't spend every morning keeping track of what players are on which teams, we will namecheck the members of this unlikely aggregation:
Logan Forsythe (17)
Desmond Jennings (14)
Brad Miller (11)
Brandon Guyer (8)
Have you figured out the team yet? And have you figured out that the numbers in (parens) are not these players' 2016 HR totals, but their career highs in HRs? We continue...
Curt Casali (10)
Logan Morrison (23)
Steve Pearce (21)
Corey Dickerson (24)
Now that's a little better, but full disclosure reveals that the the first guy and last guy on this mini-list are both hitting under .200. Pressing forward...
Steven Souza (16)
Evan Longoria (33)
OK, the jig is up. (Always wanted to use that in one of these blog posts.) Longoria is the giveaway if you hadn't gotten it earlier. The team HR leaders in MLB on 6/7/2016 were...the Tampa Bay Rays? With their top ten HR hitters projecting to a max total of 177?
 Interesting to say the least. There is something of a "southern strategy" when it comes to just trying to hit homers all the time and let the chips fall willy-nilly (as they are wont to do). Of course the Braves and the Fish blow this notion out of the water, with their combined HR totals in '16 barely reaching the league average for a single MLB team. But there are the Astros (with less of a claim to this approach without the hulking presence of Chris Carter).
And there are the Orioles ("southern"? well, "border"...) who remain besotted with the "tater tot" offensive strategy. They've been at or near the top of the MLB HR charts for a number of years now (they are first in HRs over the past four-plus seasons with 937, which is 70 ahead of the more recently-fabled "murderer's row" in Toronto).
And sanity reared its ugly head yesterday, when the Rays were shut out by the Diamondbacks--and the O's blasted four HRs in a 9-1 win over the Royals. That put Baltimore back on top in the HR race--a race they are pretty likely to win.
Friday, June 3, 2016
2016: COMPLETE GAMES #22-27

As the calendar chart at left shows, CGs suddenly clustered on the 23rd and the 30th (this past Monday, in fact).
There were three on the 23rd. Not to be outdone, the 30th conjured up four CGs--the first time in 2016 that this has happened.
 You can see the pitchers in question and their CGs in the table at right. Knuckleballer Steven Wright tossed his third CG of the season on the 30th, tying him with Johnny Cueto and Clayton Kershaw. Bet you saw that coming, yes?
There were 20 CGs in May. If we get that same number in June through September, we will wind up with 106 CG--which will mean that we'll still be stuck with triple figures for awhile longer.
Tuesday, May 31, 2016
A RECORD THAT ALBERT IS GOING TO OWN...
No, it's not the HR record. Albert Pujols, in albatross mode at this point for the Los Angeles Angels, is closing in on the top of a leaderboard that he would likely love to avoid...but can't.
It's the record for most times grounded into a double play (GIDP).
Currently the record is held by Cal Ripken, Jr., with 350. Albert has passed Cal's long-time teammate Eddie Murray (315, tied with Jim Rice) and is now fifth all time with 320 GIDP, which means that he will soon pass Carl Yastrzemski (323, who holds the mark for the most GIDPs by a left-handed batter.)
 We thought we would provide a list of the right-handed batters who were especially "good" at hitting into the double play. It's a fun list, filled with some present day GIDP wonders (can you say Billy Butler...and wouldn't you bat for this guy every time he was supposed to come up with a runner on first and less than two out?). As you'd expect, right-handed batters are a good bit more likely to hit into DPs than lefty hitters...something about that extra distance down to first base, so we hear.
The all-time rate champ for GIDP is Ernie Lombardi, who, at 4.1% of all PA's, really should have been batted for when the Reds were trailing late in a close game and a GIDP situation came up.
We doubt you'll be surprised to see the high number of catchers on this list, including two of the Molina brothers.
At the bottom of the list we've put on several familiar RHB who were especially good at avoiding the GDP. Oddly enough, all three of these guys are in the Hall of Fame...
Tuesday, May 24, 2016
2016: COMPLETE GAMES #19-21
Our first day of the year with three CGs, and the first instance in 2016 of a game where both pitchers went the distance.
Well, sort of. But we'll get to that in a minute, because we also had the first instance of a pitcher throwing back-to-back CGs. That was Johnny Cueto, who drew the Padres again and this time shut them out on two hits as the Giants won, 1-0. (This was also the Giants' second consecutive 1-0 win, having beaten the Cubs by that same score in a nationally televised Sunday night game.)
Back to the dueling CG game. The winner in the game was Clayton Kershaw, who fanned seven and allowed just two hits. (This, too, was a 1-0 game.) The loser was Reds' lefty Brandon Finnegan, who gave the Dodgers just four hits, but the lone run he allowed sealed his fate.
The reason we said "sort of" is that Finnegan was batted for in the top of the ninth, which means if the Reds had managed to at least tie the game, it would not have been a CG for Finnegan after all. However, it's a situation where he wasn't actually replaced on the mound, so it stands as a CG.
CG pitchers are now 18-3 on the season. And the current pace for CGs at the end of 2016 is now at 76.
Sunday, May 22, 2016
FREQUENCY (OR LACK THEREOF...) OF "OLD SHORTSTOPS"...
 |
| So THIS is why Buffalo has been permanently "reclined" in AAA for all these years... |

We thought it would be best to go forward age-wise a bit, just to get some perspective on all this. So we started looking at players who had at least 75% of their games at shortstop beginning at age 33. (Naturally, Jimmy is one of those players.)
And it turns out (as the chart at left shows) that there have been 89 shortstops at age 33 who meet that criteria. These 89 shortstops have had many more than 89 total seasons, of course, because many of them kept playing SS for a number of years to come (think Honus Wagner, Luke Appling, Luis Aparicio, Omar Vizquel, and the favorite of post-neo-sabes everywhere, Derek Jeter). We would add up all of the stats for all of the shortstops who've played at age 33 and up, but we fear that the effect of such a statistical aggregate would inspire some readers to discuss how useless it is to play old players. While there is some merit to be found there, the call for youth in baseball is itself a tired old saw; what we hope to make clear with this data is how rare it actually is for someone to be playing shortstop past the age of 32.

As you can see, those numbers start to dwindle rapidly. At age 34, the total number is down to 61, with only 21 playing 500+ games from age 34 on. There is something of a holding pattern at age 35-36, with the numbers settling in the 40s (total SS) and on just this side of double figures (500+ games) for those years.
It's at age 37--right where Jimmy is--where things take the final downward turn. In each decade across baseball history, it becomes uniformly rare to see anyone playing SS in the 37+ age range. The last time we had two 38-year old SS in the same decade was in the 1970s; it's happened only in two other decades (the 1940s and the 1900s).
So who are the guys who played over 500 games with 75+% of them at SS past age 37? You won't be surprised to discover that we've named them already...Wagner and Appling. It's actually Appling who played 500+ games from age 39 on; Wagner got moved to first base at age 43.
We don't expect Rollins to play 500+ games from age 37 on--his hitting probably won't hold up. But if he stays away from a Barcalounger (the damn thing has been known to fold you up inside it, pretzel-like, when the whim comes over it), he might just beat the odds.
A final note. The percentage of possible starting shortstops who've played at age 33+ is, as shown in the chart, is a bit over 3%. That's a low number. It's fluctuated over time, going as high as 6% in the 1910s and close to 5% in the 1940s, when able-bodied young men were siphoned off to war; it was just 2% in the 2000s, and right now it's just under 4% (that pesky Jeter, of course). So it's probably best if we actually savor these guys, because they really are rare.
2016: CUBS' CURRENT PROJECTION--97 WINS
 On the other hand, we prefer more direct comparisons than what Cat Garcia (omnivorizing in sync with the octupoidal reach of Baseball Prospectus' franchiseable flatulence)... tossed into her salade niçoise the other day.
There, as always, you get the serially-massaged percentage probability along with error bars (where, unfortunately, last call comes before the first pitch...) and the type of writing that reminds us of L. Frank Baum's Princess Langwidere, the girl with a different head for every occasion.
Here, also as always, we do things with the blunt elegance of a jitterbugging caveman, one who's still saddened that Madonna never took the advice of her first agent and bought the kitsch capital of San Luis Obispo (and no, we're not talking about the mission).
So when we give you a projection, it's based on actions that focus on verbs, not adjectives that have been put through a post-Procrustean strainer and set forth against the sky like an etherized prepositional phrase laid out in the chaotic scrum of an emergency room.
How did we come up with the projection in the title of this blast-from-the-past post? (As in "past blasts" against our ancient fee-fi-foe-fum, who've brought us many emperors who have remained blissfully ungarbed through thick--mostly thick, we think--and thin.)
 |
| Houseley Stevenson and his terrible towel... |
We hooked up with our sharp-tongued friend William of Occam, lathered up, shaved clean and close (as prescribed by Houseley Stevenson in his outré cameo in Dark Passage, where he then proceeds to perform plastic surgery on a pathetic, desperate guy in order to make him look just like Humphrey Bogart...), and added up the season-ending wins and losses for the team...
...Computed the won-loss percentage (.599), and multiplied by 162...
 ...And--holy Catwoman! We have a projection (as opposed to that other thing you're hoping to induce so that we'll be distracted, a la Carlos Santana--you know, the other Carlos Santana--from your evil ways).
In short, 97 wins.
Do we think the Cubs will actually win 97 games? We must still say no, we strongly suspect the final total will be somewhat lower than that. Not by a lot, as we've said before...but lower. The reasons are numerous, at least three or four more than the fact that we still think Theo's smugness ideally should have to coagulate a good while longer, while reminding you that late-blooming egotists like (Uncle) Joe Madden can only be humble if the humbling experience of not winning the Big One is part of their recurring psychological plat du jour.
Saturday, May 21, 2016
2016: COMPLETE GAME #18
Continuing his torrid start in 2016, Chris Sale tossed his third CG of the year on Thursday, limiting the Houston Astros to just four hits and one run (with 9 K's) as the White Sox tried to stay within striking distance of the Cubs' exceptional success--who will win the battle of Chicago? And could this actually be the year--the first since 1906--for these two teams to meet in the World Series?
Tut, tut--let's neither feed the hype nor get ahead of ourselves. Sale is having a QMAX "S" renaissance while having a drop in K/9--something that seems to fly in the face of post-neosabe wisdom. Ben Reiter over at SI tries to dance through the various clichés, but winds up doing a modified goose-step: what the new data still hasn't found a way to pinpoint is whether a pitcher (other than Greg Maddux, perhaps) can consistently "pitch to weak contact." We'll have to see if what Sale is doing this year stays in play all the way to the end of the season...
Tut, tut--let's neither feed the hype nor get ahead of ourselves. Sale is having a QMAX "S" renaissance while having a drop in K/9--something that seems to fly in the face of post-neosabe wisdom. Ben Reiter over at SI tries to dance through the various clichés, but winds up doing a modified goose-step: what the new data still hasn't found a way to pinpoint is whether a pitcher (other than Greg Maddux, perhaps) can consistently "pitch to weak contact." We'll have to see if what Sale is doing this year stays in play all the way to the end of the season...
Friday, May 20, 2016
WHAT DOES STARTING THE SEASON 10-30 PORTEND AT SEASON'S END??
As you might expect, the Minnesota Twins and the Atlanta Braves (who both started 0-9 and both completed the first quadrant of the 2016 season with 10-30 records) are very likely in for a long, long season.
We looked at the eleven other teams since 1901 to start the season with a 10-30 mark, and believe us when we say that the results are...ugly.

The average WPCT for these teams at the end of the season is .346.
Over 162 games, that translates to a 56-106 record.
The 1903 St. Louis Cardinals, the 1936 St. Louis Browns, and the 1987 and 1994 San Diego Padres all managed to lose less than 100 games. But those primordial Redbirds only played 137 games that season--and the 1994 Padres were spared due to Budzilla's Folly (aka the Players' Strike).
The most recent team to start the season 10-30, the 2013 Houston Astros, wound up at 51-111 for the full year. The 2006 Kansas City Royals came close to beating the 100-game barrier, but finished at 62-100.
Odds are great that both the Twins and the Braves are going to wind up north of 100 losses this season.
What team got off to the worst start? (Remember, we are talking 1901 to the present.) Why, the 1988 Baltimore Orioles, of course, who finished the first fourth of that year with a 6-34 mark...en route to a 54-107 season record.
Really bad teams do tend to get off to really bad starts--the 1928 Philadelphia Phillies and 1932 Boston Braves both began with 7-33 marks over their first 40 games, and their final records were virtually identical (43-109 and 43-111 respectively). The 1952 Pittsburgh Pirates went 8-32 at the outset, and wound up with a woeful 42-112 record at season's end. The 2003 Tigers were 9-31 in their first forty games, and cruised home to a 43-119 mark.
The only team close to the futility level of the 2016 Twins and Braves who went on go to the post-season? The 1914 "Miracle" Boston Braves, who began the year 12-27 but got hot in July and never looked back, pulling away for the NL pennant and going on to upset the heavily favored Philadelphia A's by sweeping them in the World Series.
Might we suggest that you don't hold your breath for this to happen with either of this year's slow-starting squads...
Thursday, May 19, 2016
2016: COMPLETE GAMES #12-17

Since our last post on the subject (on Friday the 13th) there have been six more, including the first two CG losses on the year. (The CG won-loss record for 2016 now stands at 15-2.)
Over at left we have your first look at the 2016 complete game calendar display. We'll fill it in and try to remember to post the final version at season's end. Dates in pink are days when there was one CG; dates in purple are dates where there have been two CGs. (We will color-code further when/if we have days with more than two CGs.)
Here's a quick list of the recent CGs:
#12--Chris Sale (CHW) joined Clayton Kershaw with his second CG as the White Sox beat the Yankees, 7-1
#13--Justin Verlander (DET) racked up the first CG loss of 2016 as Chris Tillman and two Orioles relievers blanked the Tigers; Verlander allowed only four hits and a run, but the O's prevailed, 1-0.
#14--Matt Andriese (TBR) tossed a nifty two-hit shutout at the Oakland A's as the Rays won 6-0.
#15 and #16--A real rarity, with Madison Bumgarner and Johnny Cueto tossing back-to-back CGs for the Giants against the Padres at Petco Park; Bumgarner fanned eleven, Cueto eight. (Johnny's CG was his second of the year, knotting him with Kershaw and Sale.)
#17--Steven Wright (BOS) became the first pitcher in 2016 to win and lose a complete game when he went eight innings in a 3-2 loss against the Royals in KC's Kauffman Stadium.
ANOTHER LOOK AT "BAD COMPLETE GAMES"
 We'll stick with CGs for a bit, since we've been swamped of late with non-baseball stuff.
Let's take another look at "bad complete games," which are another item on the verge of extinction (as the table at right indicates.)
 We've broken this out a bit differently than the last time we looked at this--here we define a "bad CG" as one where the pitcher allows five runs or more (with no need for those runs to be earned runs, as was the case previously.)
As you can see, occurrences have dwindled, reaching a permanent single-figure status in 2001 and moving onto "countable on the fingers of one hand" in 2003. This might be the year where we don't see any of them at all.
The other table (over at the left) shows the data by decade, with WPCTs (which, as you'd expect, have also trended downward, with a sharp drop for "bad CGs" since 1990.
Friday, May 13, 2016
2016: COMPLETE GAMES #10, #11
You didn't think we'd forgotten that Max Scherzer actually threw a complete game in his 20-K effort against the Tigers on 5/11, did you? Good gravy, if Max had struck out 20 guys in 8 IP and been pulled for the knee-jerk pitch count overcorrection that, among other things, is surely bringing CGs down into double figures, it would have been all over the sports pages...imagine not giving a guy a chance to own the single-game strikeout record.
 As it was, Max had a chance to set the record, but Tigers catcher James McCann got his bat on the ball on the 0-1 pitch, grounding out to end the game.
Truth told, Max has been pretty erratic this year; he's allowed 11 HRs in just 52 IP, including two in his 20-K game. His ERA is 4.15, and while that will very likely improve, he's not a consistently elite pitcher the way he's been in previous seasons.
And, FWIW, his CG here represents the most runs allowed by a starter-two--in all eleven CGs thus far in 2016.
 Now, for a consistently elite pitcher, we spin the dial over to Clayton Kershaw, the first pitcher to appear twice on the 2016 CG list, who mowed down the Mets last night with a 3-hit, 13-K shutout. Final score: Dodgers 5, Mets 0.
Kershaw has a 1.74 ERA thus far, 3 HRs allowed in 62 IP, and--as noted earlier--a surreal K/BB ratio (now 19.25...77 K, 4 BB).
In the 11 CGs of 8 innings or more (remember, we toss out that bogus 6-inning "CG" from Phil Hughes), the pitchers in question have combined for a collective ERA of...
0.27.
MAX MOVES UP THE LIST
Max Scherzer's 20-K performance against his old team (Detroit Tigers) got us to thinking about ways to examine the number of games where pitchers strike out more men than innings pitched.
We decided to eschew (now there's a word you don't hear every day...) the "double-digit" approach, though we wanted to incorporate those games into the mix.
 So we decided to query things up at Forman et fils by looking for games where pitchers had lasted at least six innings into the game and had a K/IP ratio of at least 1.33.
And when we ran the query, we were interested to see where Scherzer ranked. We figured he would be reasonably high up on it.
But we really weren't prepared for what we found.
No, Max isn't at the top of the list. Far from it. But as of Wednesday, after his 20-K night, he did rank in the Top 10. (As we write this, he's now tied for eleventh, since Clayton Kershaw just fanned 13 and has moved into the tenth slot all on his own.)
What is really astonishing is the number of such games racked up by Randy Johnson. We figured on Nolan Ryan being at the top of the list. He's second, but Johnson's 192 such "big-K/IP ratio" games is way ahead of everyone else. He flew by Ryan and never looked back...
Pedro Martinez is a distant third with 107 such games.
On our table, the color coding is as follows: orange means still active; rich yellow means HOFer; pale yellow means no longer active and not (yet, at least) in the HOF.
As you'd expect, big-K games produce a great deal of success, as a .709 WPCT attests. Johnson's 107 wins in such games is also a record--one that no one on this list looks like they are going to approach.
Thursday, May 12, 2016
FAT PITCHER TRIFECTA
Our hoped-for face-off between fat pitchers came close to happening Wednesday when the previously feted Vidal Nuno (Mariners) and Erasmo Ramirez (Rays) managed to appear in the same game for the first time in their careers. They did not actually pitch against one another: Erasmo pitched the seventh inning for the Rays, while Vidal's appearance wasn't until the tenth. The Mariners, currently astride the top spot in the topsy-turvy AL West, managed to eke out a 6-5 win.
But these two weren't alone when it came to "gutty" performances on 5/11. There was also a man with arguably more girth than our doughy duo combined who was on fire for the lowly Braves.
Yes, it was (and still is, presumably...) Williams Perez, who stands six feet tall but tips the scales at 240 lbs., Venezuela's favored entrant in a marathon pie-eating contest. After starting out the year at AAA, Perez was brought back to the majors when the Braves realized that they might need someone a bit weightier in their rotation if they were to escape a sub-50 win season.
Perez tossed eight innings of two-hit ball at the Phillies as the Braves did something they seem to do about once a week...which is actually win a ballgame. Final score: Atlanta 5, Philadelphia 1. (The Braves quickly reverted to form earlier this evening, squandering two chances to win in regulation, ultimately losing in 10 innings, 7-4. They are now 8-25 on the season.)
 |
| A gut for all seasons: Williams Perez. |
Yes, it was (and still is, presumably...) Williams Perez, who stands six feet tall but tips the scales at 240 lbs., Venezuela's favored entrant in a marathon pie-eating contest. After starting out the year at AAA, Perez was brought back to the majors when the Braves realized that they might need someone a bit weightier in their rotation if they were to escape a sub-50 win season.
Perez tossed eight innings of two-hit ball at the Phillies as the Braves did something they seem to do about once a week...which is actually win a ballgame. Final score: Atlanta 5, Philadelphia 1. (The Braves quickly reverted to form earlier this evening, squandering two chances to win in regulation, ultimately losing in 10 innings, 7-4. They are now 8-25 on the season.)
Tuesday, May 10, 2016
2016: COMPLETE GAME #9
 Talk about your "fat pitcher rhapsody"--here is the Red Sox' new 31-year old knuckleballer Steven Wright, who is just a bit taller than the two amigos we profiled recently but is as stout as stout can be (and that means he should really be named Guinness, not Wright).
Anyway, Steven Wright has continued to float above it all so far in 2016, allowing only 5.4 H/9 in his starts thus far, a figure that literally screams "unsustainable!" at top volume, but is nonetheless thrilling to behold in its housing bubble kind of way (assuming you're not buying any mortgages, that is).
Steven's piece de resistance (which hopefully will not presage a swift decline...) was his three-hitter against the Sox' arch-rivals (you know, the Yankees!) in the Bronx. He fanned seven, and lost a shutout with two out in the ninth when Brett Gardner took him deep.
Wright's CG was the first in 2016 where a pitcher actually gave up a run. We knew it couldn't last, and we suspect that this streak of 80 2/3 consecutive scoreless innings in complete games might be a record. We'll check into that one of these days--really, we will.
2016: NON-SAVE SITUATION WINS & LOSSES--STILL A BELLWETHER...

First, remember that this little-known category isn't quite a zero-sum thing, which rankles most analysts (whose crypto-Newtonian view of the baseball universe really depends on such a notion being the only way to look at baseball "reality") and explains why they prefer to ignore its existence.
"Non-save" decisions always add up to a WPCT that is higher than .500, which some dismiss as merely being further evidence of the uselessness of W-L records in general, but in reality show us that there are more orderly forces at work underneath the seeming chaos (as our studies show, good teams strongly tend to do well in this category).
And when there are aberrations in the data, particularly early in the year (as is usually the case, with 2016, as we will see in the chart at left, being no exception...), the extreme discrepancies that we see in partial-season data clearly have predictive value.
Just eyeballing the W-L records and ERAs of the in-process 2016 team data for "non-save situations" shows us that the better teams perform overall in the various subsets of the game where the relative score is most often a tie game, the better their winning percentage in such situations tends to be.
 And seeing the especially good W-L records of teams whose overall ERA performance in "non-save situations" is not similarly above average (as we can see is the case with the Phillies and the Rays) is a likely indicator of teams whose overall won-loss records will be dropping once the anomalous good fortune they've thus far received falls away.
As a reminder of this, we print the overall won-loss and ERA data for "non-save situations" thus far in 2016, sorted by ERA (shown above at right). The summary data in orange shows how this all breaks out based on overall performance level in this category. (Remember that average WPCT in "non-save situations" is around .560, as opposed to .500.) The summary data not shown in orange--the region between 3.50-4.49 in team ERA--shows that this middle range is pretty much dead-on with the overall average (4.14 ERA, .550 WPCT as opposed to the 30-team MLB aggregate of 3.99 and .560).
Thursday, May 5, 2016
2016: COMPLETE GAME #8

Kluber wound up scattering five hits, and fanned seven. Cleveland scored four in the fourth off Annibal Sanchez, and that was enough for the Tribe to beat the Detroit Tigers, 4-0.
CG pitchers in '16 after 72 IP have allowed just 26 hits, walked just nine, while amassing 79 K's.
Monday, May 2, 2016
FAT PITCHER RHAPSODY
 Two fellows we like really could be mirror images of one another.
Lefty Vidal Nuno, despite his exotic name (a strange combination of hairdresser and foreign spy) is actually a U.S. citizen. He's also a chunky southpaw who has a mind-bending 4-19 lifetime won-loss record.
Righty Erasmo Ramirez is from Nicaragua, and it's his birthday today (May 2; he's 26.) He still hasn't managed to get into a game on his birthday, as his team (the Tampa Bay Rays) had an off-day. Physically (5'11, 205 lbs.) he's the Central American version of Fat Freddie Fitzsimmons--and for a nice stretch last year upon joining the Rays, he pitched like the Giant of yore.
 Both began as starters and now are working out of the pen, where their less-than-svelte appearance is more in keeping with the anonymity that usually accompanies being "one of the boys" who sit out in left field trying not to get caught picking their nose in public. Nuno is now toiling for the team that first brought Erasmo up to the majors (the Seattle Mariners), so we can feel good that they are still managing to meet their "fat pitcher quotient."
Neither one of these guys is going to make us forget about the other Fat Freddie, Fernando Valenzuela, but he and Nuno each managed to have a most unfortunate year where they lost 12 of 14 decisions. For Valenzuela, it was the end of the line; for Nuno, it was the beginning of a nomadic time that included another stretch in the minors.
 Erasmo nearly pitched his way back to the bush leagues in his first two outings for the Rays in 2015; in those games spanning 5 1/3 IP, he managed to allow 15 earned runs, which works out to a 25.31 ERA. The Rays didn't panic, however, and kept putting Erasmo out there, and from that point until mid-July Erasmo had his finest stretch as a big leaguer, posting a 2.06 ERA over his next 78 1/3 IP and amassing an 8-2 won-loss record.
So far as we can tell, Vidal and Erasmo have yet to appear in the same game, but our big chance is coming up next week when their teams (Rays and M's) will square off in Seattle. Both men are pitching out of the bullpen, and pitching well, so there's a chance that they might wind up in the same game together. Sure, the knee-jerk response is "fat chance," but we say "give the fatties a chance." The teams that have done so haven't regretted it, and for us it will the opposite of regret if these two wind up pitching directly opposite one another next week. Stay tuned!
2016: COMPLETE GAME #7
 Back to the prevailing pattern of low-hit, high-K shutout CGs as the Dodgers' inestimable Clayton Kershaw fanned the first four batters he faced, singled in the only run of the game (and was thrown out trying to advance to second--they don't want you sliding, Clayton!) and wound up with a three-hit, 14-K shutout against the Padres in Dodger Stadium (where his lifetime ERA is 2.08).
Just another day at the office for Kershaw, who is currently sporting an 18-to-1 K/BB ratio. (We kid you not: 54 Ks, 3 BBs.)
BEST HITTERS AUGUST 2015-APRIL 2016
From David Pinto's Day-by-Day Database, here is a three-month snapshot of hitting that includes the first month of the 2016 season:

Who would have thought that the ancient Big Papi would still be raking like this? As brilliant as the Red Sox were for signing Ortiz back in 2003, it must also be said that the Minnesota Twins pinned the clueless meter by releasing him in the first place.
BTW, we love David's database, particularly for its usage of players' given names, such as "Senger" Peralta and "Markus" Betts...
Sunday, May 1, 2016
2016: COMPLETE GAME #6
 CG #6 was not one that could have easily been predicted, for several reasons. First, lefty Wade Miley (who'd been a bust for the Red Sox in '15 and was shipped to the Seattle Mariners for another problem lefty,Roenis Elias...) had not pitched well in any of his starts thus far in 2016. Second, he was facing the Kansas City Royals, who had actually shown a pretty good knack with lefties in 2015.
That proved not to be operational on April 30 at Safeco Field, however, as Miley became the sixth pitcher in 2016 to go a full nine innings, scattering five hits in a 6-0 M's win over the defending World Champs (and yes, we pinched ourselves three times as we wrote those words).
Miley was not throwing heat past the Royals; he fanned only four, and continued to give up line drives and fly balls at an elevated rate...but the generous dimensions at Safeco and a couple of nice plays by CF Leonys Martin boosted him at key moments.
That's six CGs, six shutouts thus far in 2016.
Saturday, April 30, 2016
2016: ODD FACTS & FIGURES AS WE LEAVE APRIL
Just a few odd facts and figures here, nothing elaborate or in any way comprehensive. The first thing that leaps out is the disappearance of the home field advantage (at least thus far in 2016):
AL teams at home: .509 WPCT
NL teams at home: .457 WPCT (!!!)
That last stat is not a misprint. We have some NL teams having an incredibly tough time winning at home. First, the Atlanta Braves, who, of course, are off to a disastrous start but who've done most of their self-gravedigging at home (1-12). Then, the Miami Marlins, playing much better overall but struggling at home (2-7). And the T
T, usually built to play well in their home field, but not doing that thus far in 2016 (4-7).
This would be more readily explainable if the NL were tanking in interrelate games, but the weird thing is that they aren't (at least not yet): as of this morning, they actually have a 15-13 lead over the AL. (They are only 7-8 vs. AL teams at home, however.)
It's inconceivable that the NL will keep this up all year, but at the moment they rank 234th out of 234 league-years in terms of home field "advantage." The next closest "home non-advantage" occurred in the 1953 AL, when home teams posted a .491 WPCT. (Three other leagues had sub-.500 home records, all in the NL--in 1917, 1923, and 1972.)
Meanwhile, the AL isn't doing all that well in this area, either. Their home WPCT thus far in 2016 is only .509. That ranks 223rd out of 234 league-years.
 Last season the leagues had very normal home WPCTs: .540 in the NL, .543 in the AL.
Then we have the Chicago Cubs. Of course, the mainstream media has expected them to dominate the NL this year, and April has been like a dream. Their 17-5 mark after 22 games is second only to the 1907 team, which began 18-4 (we are omitting nineteenth-century incarnations. This year's Cubs are having a better start than the 1906 team (16-6) which went on to win 116 games.
But underlying that incredible start are some other numbers that might be worth some pondering. These are related to the home WPCT stats we were looking at above. The chart at left shows the record for all MLB teams when they play at home against "good teams" (those with a .500+ WPCT). Over all of baseball history, this WPCT is under .500 (the exact WPCT is .479). As you can see, this year that WPCT is, again, down near historical lows (.404). Only 1912 (.375) and 1954 (.380) are lower than the current 2016 home record against good teams. (Last year, this particular WPCT was .505...so we have another astonishing reversal on our hands.)
What's interesting is which team you don't see on that list. That's right: the Cubs have yet to play a single game at home against a good team. Now, the Braves have already played thirteen--that's all of their home games (and, as you might recall, they are 1-12 at home). Six other teams have already played 10+ games at home against good teams.
 Of course, some of these numbers are likely to change as certain teams move over or under .500, but it's still striking to see that some of the Cubs' start has to be seen as scheduling fortune.
We can see the corollary in the opposite breakout--teams' records thus far at home against "bad teams" (those with WPCT of .499-). Instead of there being only one team missing from the list, there are seven missing here (yes, the Braves being one of them: some of the other teams who've yet to play a bad team at home are the Oakland A's, the Los Angeles Angels, the Houston Astros, the San Diego Padres, and the Chicago White Sox).
Now, as noted, this will change and some of this will even out...but it really is striking that there have been so many more games played in home parks against good teams this month (203 as of 4/28, compared with just 122 against bad teams--that's a 66% difference).
This is such a big difference that it simply may be a scheduling aberration; we will try to keep tabs on this as the season unfolds to see if we have another month like this where the opposite type of result occurs. (And we will try to figure out a way to go back and recalculate these numbers at the year's end to see how much this April data may change as a result of teams jumping categories when they move over or under .500.)
But for now, the season has begun as a blazing anomaly--and wouldn't it be something if it actually stayed that way?
Subscribe to:
Posts (Atom)