Wednesday, February 29, 2012

BILL VEECK, PAUL DICKSON, BASEBALL RELIQUARY...

Good news: a few weeks after Opening Day 2012 (April 24th, to be exact), Paul Dickson's biography of Bill Veeck will be published. Order your copies now and be prepared for an immensely pleasurable reading experience: in the parlance of the game, this is a terrific match-up.

Dickson, honored for his indispensable and wide-ranging research by the Baseball Reliquary last July at their Shrine of the Eternals induction ceremony, will re-team with the indefatigable Pasadena pranksters for an exhibition honoring the irrepressibly irreverent Veeck, which will debut at the Arcadia Public Library on April 9th. "Bill Veeck, Baseball's Greatest Maverick" will run there through May 24th.

In mid-May, Dickson will travel to Los Angeles for additional Veeck-related events, culminating with the details-to-be-forthcoming "VeeckFest," to be held on Saturday, May 19. No word as yet as to exactly how many "baseball munchkins" the Reliquary will round up as part of their hommage to the man who helped teach them everything they know, but the element of surprise should never be underestimated...

Cementing their rep as "the greatest little anti-institution in baseball history," the Reliquary will have a wraparound exhibition that examines baseball's integration efforts, entitled "And The Walls Came Tumbling Down," which will open at the South Pasadena Public Library on May 1st and will run for the entire month of May.

Tuesday, February 28, 2012

"TRIVIA" QUESTIONS PRECEDING MONEYBALL FUNERAL SERVICE...

Buy the French DVD--reportedly dubbed into Français by Simon,
Theodore, and Alvin...who also reveal just what precisely were
the inducements that got "M'sieur Brad" to play Billy Beane...
Yes, coming soon! To be entitled, in honor of the Oscars getting it right: "Shutting Out Moneyball."

But first, three "trivia questions" that will be semi-germane to the discussion in that oh-so-acrid essay. Both deal with levels of "in-season play," and they are referencing a subset that's one of the lengthier measures of team performance within a season (108 games, or what is now two-thirds of a season--prior to expansion, it worked out to 70%, but who's counting?).

Trivia question 1: From 1901-2011, how many times has the team with the best record in any 108-game segment (in the ranges from 1-108 to 55-162) played over .700 ball during that stretch?

Trivia question 2: How many times has the team that's produced the best record over a 108-game stretch in any individual season NOT wound up as a pennant winner or playoff team? We might call this "dropping the ball."

Trivia question 3: Per #2, what team is the most recent franchise to "drop the ball"?

In case you were wondering: you can't Google these, you'll have to do it the old-fashioned way...

Saturday, February 25, 2012

HISTORICAL SNAPSHOTS: HOW THE SHAPE OF HITTING HAS SHIFTED...

Ever think you are living in a time when the game of baseball is, well, less than it might be? That the game has reached a level of uniformity that is disturbingly akin to that metallic taste that occurs in overprocessed water?

Ever had that feeling, but haven't been able to put a finger (or any other appendage, for that matter...) on why you feel that way?

You've come to the right place. We have that feeling at least three times a week, sometimes more when we go to certain web sites. (Which reminds us of the famous gibe about the patient who went to see his doctor. He's in the exam room, the doctor comes in; the patient exclaims: "Doctor, I'm so worried--whenever I raise my arm like this it hurts". The doctor waits a beat and replies: "Don't raise your arm like that.")

What we want to do is to display this increasing uniformity in a very simple way, one that doesn't get bogged down in "advanced metrics." We've decided to do that as follows:

--Take a group of hitters whose level of performance is very good, but not great. Players who usually the second and third best hitters on their teams.

--That range of performance, after some trial and error, was determined to be an on-base-plus-slugging (OPS) in the range of .850 to .860. Over the course of baseball history, that performance level has resulted in an OPS+ of 130--as noted, very good but not great. Players with a lifetime OPS+ of 130 are often in the Hall of Fame, but players who have an individual season of 130 where the range of OPS is .850 to .860 are  still longshots for induction: only 21% of the 224 seasons in the study were by Hall of Fame players.

--Criteria for inclusion in the study: 600+ plate appearances in the season with an OPS range of .850 to .860.


The first thing that an historical overlay of these seasons shows is that offensive levels have a significant effect on just where an .850-.860 OPS ranks in terms of league-relative achievement. You could draw a serpentine line through the graph that would show the ebb and flow of run scoring levels. The highest OPS+ for a player with a OPS between .850-.860 occurred in 1906, when Nap Lajoie's .857 OPS translated into a 169 OPS+. The lowest such OPS+ can be seen at the bottom of the first offensive explosion: Gus Suhr's 1930 OPS of .860 only translated into a 106 OPS+.

That's the effective range, though the scatter chart shows that the vast majority of these seasons fall between the 120-140 OPS+ middle ground (68% of the seasons, which is what those in the stat biz like to call a "steep bell curve"). The chart above also shows that while we are moving away from a high-offense era where the .850-.860 OPS range is no great shakes, we are far from the conditions where such  offensive production was significantly above average.

The shape of this performance is what should interest us, especially as it has changed over time. The chart below shows the aggregate performance of .850-.860 OPS hitters in twelve decades since 1900.


In that data, we don't see much movement in the OBP/SLG components, but we do see it in stats that help define the overall shape of a player's performance--isolated power (ISO) and what we call the "on-base ratio" (abbreviated here as OB%), which measures the percentage of OBP-BA that is part of the overall OBP.

As you can see, both these stats began to rise in the 1940s, as did the raw total of home runs and walks. The portion of hitting that derives from what classic neo-sabes like to call the "three true outcomes" (a phrase that has led to a series of "insights" that remain problematic in terms of an overall historical perspective on the game), represented as HR+BB+SO, has risen dramatically over time. HR+BB+SO constituted just under 14% of all plate appearances in the decade of the 1900s; in the first decade of the twenty-first century, that figure had more than doubled, to 30% of total plate appearances.

The only point in time where this progression reversed itself was during the 1970s, when isolated power declined among good-not-great hitters even as the overall ratio of walks/OBP showed an uptick, registering its highest overall percentage. These players produced a much higher aggregate OBP--highest since the 1920s, when the .850-.860 OPS hitters had their production driven by batting average.

So what the 1970s had was a kind of offensive balance that registered in its very good but not great players. How do we visualize this balance, however? The aggregate numbers seem mighty subtle, and probably don't get the idea across.

What we can do, however, is display the extreme edges of these hitters as arranged across the decades. The extreme edges are defined by the S/O ratio (the second-to-the-right column in the above table). What is that? It's the SLG divided by the OBP, and this is an average that hasn't fluctuated much.

But there is a range to be found in the individual players, and the diagram below captures the edges by segregating the .850-.860 OPS hitters into groups of high and low OBP. High is defined as .390 or higher; low is defined as lower than .360. The higher OBP guys have a lower SLG/OBP (S/O) ration, and show up in the clustering at the bottom of the chart (1.20 and below), while the lower OBP guys, with a higher S/O, cluster at the top (1.40 and above). The resulting groupings of these extreme edges show how the very good but not great players have been forced to conform to a lower-OBP, higher-SLG configuration:


The sample here represents a little over half of the players in the .850-.860 OPS range; the other half reside in the middle regions of the SLG/OBP ratio and would clutter the chart in a way that would not just be unseemly, it would render the lesson of the extremes to be downright unseeable.

For the first forty years of the twentieth century (1900-39), the great majority of .850-.860 OPS players achieved an OBP of .390 or higher--78%. Over the next forty years (1940-79), the two extremes achieved an almost perfect balance, with the high OBP still prevailing (52%). The trend toward lower SLG/OBP ratios (and higher OBPs) had its last gasp in the 1970s. Over the course of the last thirty years, lower OBPs and higher SLG/OBP ratios have come to dominate the game--70% of good-but-not-great hitters now reside at or above the 1.40+ SLG/OBP ratio, with that figure nearing 80% in the last decade. Good-to-great players with low SLG/OBP ratios (and high OBPs) are becoming extinct.

We hear about how "OBP has been assimilated into baseball's market evaluations." It would be more accurate to say that OBP has been neutralized, but not because GMs are seeking players who can actually draw walks. In fact, the opposite seems to be what's occuring.

Our chart shows that the trend started contemporaneously with Bill James's first decade as baseball's outsider iconoclast, and has only solidified itself despite the valorization of walks and OBP that's been the bedrock for sabermetric theory over most of the intervening years. Though the sample size is much too small with which to draw conclusions, the early returns from our current decade indicate that walks are continuing to decay as a feature of "good hitting" players, and that the uniformity of an approach built around a higher SLG/OBP ratio is continuing to gain ground.

That's sad news for baseball, because the game that emerges from such a trend is far less interesting and a good bit more predictable than what preceded it. Of course, the uncertainties that have been superimposed on baseball by its expanded post-season tend to mask this uniformity, but we have far less of a strategic range in how teams are/can be constructed to score runs now than was the case in the 1970s.

This uniformity is mirrored in the overall direction of neo- and post-neo studies, and in how those studies are defined. ("Value" is an 800-pound canary, while "shape" remains mostly a phantom presence.) While that work operates under a patina of objective science, it stops short of adjusting itself in terms of what it is attempting to study and thus is silent with respect to its truncated historical perspective. A question that current sabermetric study consistently avoids asking is whether the game as currently deployed is optimum. It's a loaded question, one filled with value judgments that cry out for a broader application of scientific techniques--but a mature science should prove capable of answering it. It is becoming more urgent for sabermetrics to at least address this issue, because a game where the SLG/OBP ratio is drifting ever higher is a game that has begun to calcify from within.

Thursday, February 23, 2012

SO MANY SIDE DOORS, SO LITTLE TIME...

We have two parallel exercises in what might be called "transparent sidestepping"--the art of feebly waving one's arms in one direction while diverting one's eyes the other way, thus revealing the truth inside the sham and the sham inside the truth.

The first one is found in the news that Ryan Braun's suspension appeal has been upheld due to MLB's apparent usage of the LAPD "chain of custody unit" (which, by the way, was never actually proven to be the weak link in the O. J. Simpson case--the "Trojan horse" there was a racist cop).

The second one is found in the latest incarnation of the Hall of Fame wars, this time in the hands of Joe Posnanski, who found it necessary and desirable to take a passive-aggressive swipe at Jim Rice so copiously parsed (a la Bill Clinton's excruciatingly arcane hair-splitting on the definition of oral sex) that the actual motive shines like a crazy diamond even as it seemingly remains hidden in the sleight-of-hand that is Poz' shell game.

Let's save the brains for later and start with Braun. Rob Manfred, MLB's counsel, isn't going to win an Oscar for his "vehement disagreement" with the panel findings that tossed out Braun's test results.

Rob Manfred: secretly untying the
Gordian knot??
Folks, please remember that we are still in the Bud Selig era (which still abbreviates to the BS Era, in case you've forgotten). MLB doesn't want to have a tainted MVP, now, do they? So why would it be so surprising that they would figure out a way to ensure that Braun's appeal would prevail, even as they purport to disagree?

Please note that there is no assumption of guilt or innocence here with respect to Braun. The argument is simply that MLB would find it in its best interest to not have the embarrassment of an MVP who was found guilty, even in a "false positive" scenario. So the best way to ensure that the entire matter will flutter off into a morass of confusion and anti-climax is to botch the chain of custody.

With such a strategy implemented, Bud and his boys can concoct a hand-wringing, highly plausible (if you throw a towel over your head to muffle that uncontrollable giggling, that is...) scenario where human error trumps HgH, where a rogue twit (conveniently deployed as a courier...) tramples the vintage where the grapes of wrath (aka testsoterone) have been ruined by promiscuous refrigeration.

And the game can go on with everyone clearing their throats on cue, grimacing and gesticulating, vowing that their unmitigated disaster of a testing program will one day become the type of protective shield you can take home to Mother.

Those "curiously long" posts from Poz have more than a little bit
in common with this geographical phenomenon....
That's how you get paid the big bucks, kiddies.

Now, on to Poz and his pose. Let's face it: you know Joe is up to something when he tries to sneak Mike Cameron past us as a proxy for Jim Rice and "fails" to reference his friend and mentor, Bill James--whose Win Shares system could have answered the question with about nineteen hundred fewer words than Poz deployed in what is becoming a more and more pronounced Parkinsonian "ox-bow rhetoric" (you know, when the river just keeps bending back and forth, back and forth).

It's clear that this approach is deliberate, as ol' Poz tries to make it look like he's not dumping a load on the BBWAA for putting Rice in the Hall by comparing him to someone whom everyone knows is not a Hall of Famer. But Poz' need to linger over the back-and-forth, meandering around the same point, is a dead giveaway that this is a passive-aggressive act of solidarity with the man who just posted a metric ton's worth of his Win Shares data in a tiresome "open letter to the Hall of Fame" (the organization he kicked in the head back in 1994).

Coinkydink? James brings out his archer's set to aim
for a bullseye HOF argument on Dwight Evans; a week or
so later Poz brings out the scaled-back "tainted X" for
Jim Rice...
Poz could have saved a lot of time by simply quoting Bill's system, which shows that Rice is ahead of Cameron by about thirty Win Shares (or ten wins). The exact figures: Rice 279, Cameron 246. (Mike makes up a lot of ground from Win Shares' defensive component...and in support of Bill, let's just note that the scale he uses to measure defense in his system is a helluva lot more credible than the ones built around Wins Above Replacement--which aren't consistent with the method used to calculate offense, are built around shaky premises and assumptions, and just otherwise smell funny.)

But this wouldn't have been enough of a knock on Rice, or such a carefully-calibrated meander around the so-called "art" and "science" of baseball. It was necessary for Poz to toss up the road numbers of the two players, which bear some superficial resemblance to one another.

Again, a simple summary stat--adjusted on-base-plus-slugging (OPS+)--would have been the best way to compare those numbers. In fact, ol' Poz uses those to look at the overall hitting accomplishments of Rice and Cameron. For some reason, though, he doesn't choose to use it when looking at their road stats.

And why is that? Well, possibly it's because if he did so, he'd have to acknowledge a bit more overtly that the differences in offensive levels between Rice's career (70s-80s) and Cameron's career (90s-00s) are significant enough to put some distance between their road stats when these are presented in league-relative terms.

Mike Cameron, whose overall performance in Fenway
didn't measure up to the rest of his career.
When we do that, we see that Rice's OPS+ on the road is 119, while Cameron's is 111. While that puts Cameron within shouting distance of Rice as a road hitter, it is not "pretty much identical," as Poz is so off-handedly attempting to claim (and the wording there is masterful in its casualness, the unmistakable signature of someone whose parsing skills are on a par with those of our controversial, too-sexy-for-his-smirk 42nd President). It's a brilliant attempt at scale distortion--where the larger issue is granted, but the special pleading, the appeal to a context that is presented with the most scant amount of evidence possible--worthy of some of his mentor's brusque efforts in this regard over the years.

Rice, of course, used Fenway at a level that clearly overawed his supporters. Many others didn't. (Cameron, for one. He hit only .227 there.) Another player who took major advantage of his home park was Ron Santo, but this remains the most carefully buried of all statistical facts in the long campaign to get the Cubs' third baseman enshrined. Santo has seemingly gotten credit for Wrigley Field as somehow being just part of his repertoire, while Rice is dressed down for his success in Fenway.

Now please don't think that any of this constitutes a defense of Rice's induction. We are still on record as supporting Santo's induction, while finding Rice to be a player whose peak has been overvalued by the Hall of Fame voters.

What we really are saying, of course--to Poz and Bill James, and all of those who've rallied around (G)rantland as a place to gleefully jump the shark--is simply this:

Get. Over. It.

Even this kind of shambling, ox-bowed, excruciatingly parsed, infinitely resigned posturing is clearly nothing more than the pea of rage being slung around in a rhetorical shell game.

You guys are still mad about Jim Rice, and you are showing virtually no ability to put it behind you.

Just let it go.

Prediction: if Poz writes about Jack Morris in 2012, that will be the tipping point...so hold your tongue, Joe!!

Monday, February 20, 2012

SHOCKING! "REAL WORLD PROOF" THAT MONEYBALL LITERACY IS WANING...

In the impending wake of that Mayan world-destruction thingee, the Earth just keeps slipping off its axis...whispers and shouts have begun to abound in the baseball world to the effect that the post-fin de siecle hegemony of Michael Lewis' pox baseballiana, Moneyball, is entering its death spiral.

We're apparently going to have to get those last digs in soon, since these real-world rumblings are confirming the copious research that our capricious associate, 3-D "Don't Call Me Crash" Davis, has conducted for us with a series of fearsome algorithms and one very large, gnarly piece of wood (he claims it's a divining rod--we suspect he may be "massaging" the data with it...though "flogging" might be a more accurate term).

Anyway, 3-D's method (such as it is...) involved sifting through millions of on-line records to determine what he called (when he wasn't doing 12-ounce curls with his Aryan beer of choice...) the "Moneyball literacy index." What he discovered was that it wasn't Billy Beane's cult of personality that drove the "discourse" concerning the book and what it offers as a "narrative" (there's that word again...) about roundball and crooked figures.

The shocking separation of what made Moneyball the book a lightning rod and what made the film adaptation a commercial success is captured in 3-D's chart, which we've dumbed down with all of the excruciating attention to detail that we're so known for in our hazy attempt to emulate those who've made their pound of flesh via claims of "deadly accuracy."

The chart shows that the post-season success of the Boston Red Sox in 2004 and 2007 (as promulgated by recently departed GM Theo Epstein) is what pushed the Moneyball discourse upward in a pattern that is disturbingly similar to the "fake bull market" on Wall Street during the same time frame. (Happily, Moneyball proved impervious to the world-wide financial crisis and, as the chart shows, glided through that volatile period, thanks in part to the long gestation period for the inevitable movie adaptation.)

But 3-D's big finding is that as the film moved into production and pushed inexorably toward an actual release date, that Moneyball discourse began to founder and, in a kind of pinnacle of counterintuitivity, began to fall even as the film went on to gross over $100 million at the box office.

3-D isn't 100% certain that the index will continue in freefall in '12 (then again, he's not certain where his next meal is coming from, now that his analyst job with the shadowy independent, rifle-rack-funded franchise, the Idaho Grifters, has been put on "hiatus"), but the signs seem to indicate further retrenchment. Epstein (pictured in the graph refusing the offer of a free screening of the film...) has gone on record that divulging proprietary information is akin to some kind of socialist conspiracy. Bill James has gone on record as claiming that he never read the book in the first place.

And, frankly, why would they? Bill is professionally uninterested in reading a book where they write about him [EDIT: ...except when he conveniently forgets, nine years hence, that he's at least partially read the book]; Theo, with his preternatural media savvy and his familial connections to the entertainment industry, isn't interested in seeing a baseball movie that doesn't tell his story.

But the combination of disinterest and shoegazing displayed by two of baseball numberologism's biggest icons is almost certain to drive down the suddenly fragile literacy index into a quagmire of confusion and lack of consensus, until the entire concept will be rendered...meaningless.

Hey...wait a minute...

Friday, February 17, 2012

BROWSING IN THE KID'S CANDY STORE

Just a quick entry to commemorate one of latter-day baseball's galvanizing figures--Gary Carter, who left us the other day (aged 57) much too soon. The stories about Carter's larger-than-life personality are so well-documented that it would be redundant to reference these at any length, except to say that behind any impression of self-aggrandizement that Carter may have demonstrated over the years lay a child-like heart of gold. He was not called "Kid" for nothing, even when he had occasion to behave badly.

So just a couple of nuggets mined from Forman et fil to characterize Carter's on-field skills, which never overtly screamed greatness but blended into the gestalt of a Hall of Famer in the way that some pieces of music carry more than just the collection of notes that comprise it.

A feature of the Kid in his prime was his ability to play so many games at a grueling defensive position and still have so much left in September--it was his best month, and over the first twelve years of his career (full seasons: 1975-86) he posted a .297/.368/.497 line. That .865 OPS was quite an achievement, particularly considering the cumulative effect of catching.

Forgotten by virtually everyone was Carter's stretch-run hitting in 1985, when he hit 13 homers in September-October as the Mets relentlessly stalked the St. Louis Cardinals in one of the great division races (with no wild card safety net in place at the time).

1987 was the point when Carter's skills as a hitter suddenly atrophied, and his stretch record from that point forward (.232/.296/.377) reflected his early decline (right at the often-crucial age-33 turning point that we've seen before).

The joy of no-no: Gary Carter collars Charlie Lea after catching his no-hitter,
May 10, 1981
As a defender, Carter is sometimes overlooked for his skills, particularly with respect to controlling the running game, but for a ten-year stretch (1974-83), he was at or near the top in this area, throwing out 42% of opposition baserunners attempting to steal. Those skills began to erode in 1984 and would plummet during his years with the Mets, bottoming out in 1988 when his throw-out rate crashed to 19%.

While he was a much diminished player from age 34 until the end of his career, Carter's accomplishments with the (tragically murdered and still lamented) Expos were the stuff of legend. He played with a burnished glow that more than occasionally spilled over into a kind of rapture which transcended self-congratulation even as it mimicked it. His emotions were tangible--sometimes cocky, more often overflowing with wonder.

Rest in peace, Kid. Thanks for everything.

Thursday, February 16, 2012

CESPEDES = CRUZ: LATE BLOOMERS, BROKEN CIRCLES & MO(E)BIUS STRIPS

Let's begin with some pointed misdirection...

1) Does it seem as though the 2011-12 offseason has been unusually long in unfolding? We are days away from spring training and there is still a considerable amount of activity that hasn't happened yet...someone with time on their hands and some semi-pronounced database skills might just compare the pace of transactions across time, and see if this impression holds up.


2) What is undeniable, however, is the increasing emphasis/investment in foreign players who are expected to step in and contribute immediately at the big league level.

3) Which brings us to Yoenis Cespedes--no, wait, we need to comment about Billy Beane. (It's not as if we haven't been doing this for more than a decade, having been the first to look askance at the much mythified one--even before Michael Lewis brought his meatgrinder to things.)

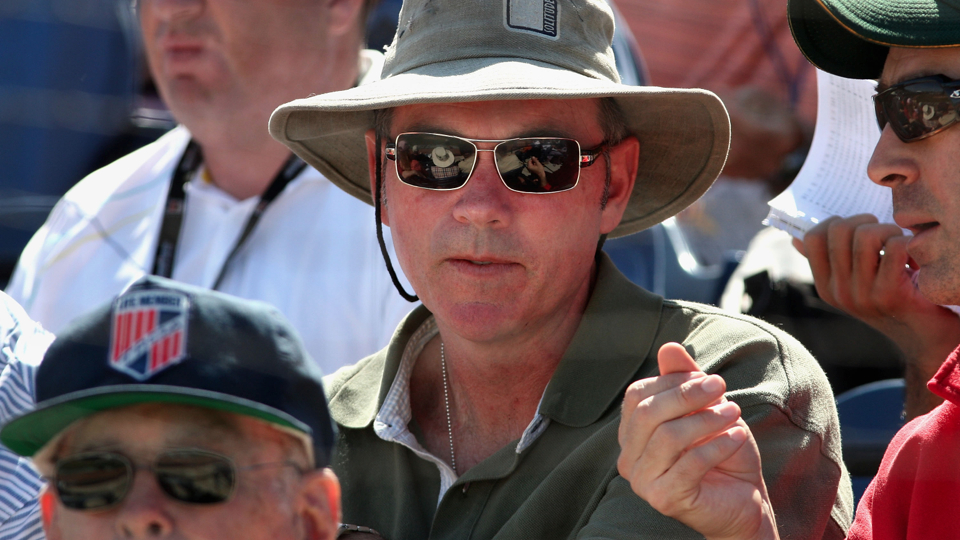
Billy Beane 2012: in full camouflage mode
Please note that Beane's new extension means that, barring some kind of cosmic disaster (wholesale worldwide nuclear meltdown, Nate Silver running for office, Murray Chass and Darren Viola moving in together...) he will be employed by the same up-down, over-under, sideways-through franchise for 20+ years--the type of IBM-style stability that seemed impossible (at least until someone invented this "slogging" softwear, which theoretically permits someone industrious enough to go on forever, posting post-mortem well after rigor mortis).

It's probably the most counter-intuitive aspect of Beane's entire career profile--at least as the frozen-in-time, Brad Pitt-in-amber-waves of engrained fast-and-loose-with-the-facts-ma'am set of circular signifiers would plop it down in front of you like a cup of ice cream that had been thawed and refrozen a couple dozen times by a mischievously malfunctioning refrigeration unit.

That said, it's as strangely comforting as it is comfortably strange. All of which is prelude to our Mo(e)bius strip meta-analogy, where GMs (and regular folks) embrace what they have discarded, proving that a broken circle (or, in the case of Eno and Cluster, a broken head) can be stapled, glued, or otherwise unceremoniously reaffixed, albeit not without a twist.

SO what is that twist--that ironic echo that makes history into a tail-chasing ouroboros? Well, it's just this: Cespedes, the Cuban star whom the A's have just signed for $36M over four years, is a virtual clone of the Rangers' late-blooming Nelson Cruz. It's rather astonishing that few if any have noted this as yet (but that's why we're here, smirking in the bulrushes) but there you have it: two linebacker-y guys with circular, windmill swings and the Caribbean tendency to flex rather than flow.

Cruz is a product of his ballpark--he's a superstar in Arlington, but close to a replacement-level player elsewhere. A collateral irony is that the Rangers have just tied themselves to an odd contract with Cruz, one that seems likely to pay him the most when he might well be producing the least--the two-year, $15M deal pays out the lion's share of dough in 2013, which is probably the year that Cruz, who's looking a lot like the type of player Brock (Broken Head) Hanke so cannily characterized so many years ago as a "cream skimmer" (a guy with a late, truncated peak that is sort of a "supernova" from a series of power-hitting adjustments at AAA which play themselves out over 4-6 years in the majors).

But there's another, far more interesting twist here. Cruz passed through several teams before he bloomed in the hothouse environs of Arlington. The second of these teams, in fact, was the Oakland A's (2000-04: he never made it to the big club).

Billy Beane, in some earlier incarnation of his restless, listen-to-his-daughter-sing-songs-ripped-off-from-Juno-apparently-before-there-was-a-Juno-to-rip-off, late-mid-early ouroboros phase, traded Cruz to the Brewers for a backup infielder named Keith Ginter. (Ginter is one of Beane's Leggo-that-Eggo-on-my-face transactions, one of several can't-miss rip-off trades that backfired...Charles Thomas is another one.)

Cruz got traded to Texas in 2006 and his swing got tweaked--the circle was broken and reattached, so to speak--and, by 2008 he was a late-blooming slugger. So much so, apparently, that otherwise canny Craig Wright was fooled by his abbreviated 2010 season into thinking he was actually a star (pays to look at those home/road splits, folks--it can happen even to the near-best).

So Cespedes is, simply, Beane reinventing a player that he discarded. Not reacquiring, of course. Reinventing, as a matter of doing what most baseball GMs do--chasing their own tails. (The canny detail in the A's contract with Cespedes is that they can trade him at any time: in the monetized gas chamber within the prison-house of baseball, this is a key detail. It's most important to always be able to break that circle and reattach with as many umbilical kinks as seem appropriate at the time.)

Cespedes, like Cruz, is exciting. He may have a bad ballpark fit (odd corollary fact: Cruz can't hit a lick in Oakland, an irony that falls on the proton side of Beane's charge card: to wit, a .194 BA and a .567 OPS) but he's got that same macho flair. If he hits .250 with 20+ homers (and all of baseball's digital projectionists are grope-thinking at this level of achievement--funny thing, that..), he will get a pass from the reeling A's fan base and should settle into a level of "cream-skimming" that will give Beane sufficient maneuverability as he divines future head-fakes.

Roy Liechtenstein channels the aftermath of Moneyball,
four decades before its invention...
And privately, Beane must be wryly amused at how the term he's been lumpened in with ("Moneyball") has been so thoroughly circularized, broken, reassembled and kinked up to the point where the snake can no longer be sure whether his insides are outside or vice-versa. It now has so many "true definitions" that it can literally mean just about anything to anyone, and the fact that it contradicts itself is its own proof, leading to the type of self-destructive pride that underlies virtually all of the "cling to the model" behavior that those yoked to the delusions of "consultant culture" must play out no matter the cost. It's like what happened when abstract expressionism went "pop": the structures that had allowed a cadre of interlopers to decenter meaning into a self-consuming, chase-its-own-tail myth were slammed up against a meta-ironic backlash that crammed pop culture down the throats of those who would otherwise have stayed in their mom's basements.

Sea-change? Cluster-f*ck? Plus ca change, plus c'est la meme chose? Yes, yes, yes. But, in the all-too-soon-to-be-Mo(e)bius-ized words of Vittorio Gassman in the great Italian comedy Il Sorpasso, 'tis better to chase tail than chase one's own tail--until, of course, it becomes clear that it's all one and the same.

Friday, February 10, 2012

GETTIN' DIZZY: TWO-YEAR WIN DATA, 1901-

Dizzy Dean was exhumed the other day--no, not literally--and there was the usual 60/40 split in the numbers world over his induction in the Hall of Fame. Given the penchant in the numbers world for marginalizing the concept of peak, this is about business as usual for ol' Diz, whose two famous appendages (his mouth and his toe) figured large in his short, meteoric career.

In an era where starting pitcher wins don't mean anything (except when someone like Justin Verlander wins a bunch and becomes MVP), it's harder to appreciate the impact of workhorse pitchers; Dean's achievements during his peak have become subject to the gravitational effect of the "advanced metrics" that purport to measure his value.

Contexts have changed, of course. No one can now do what Dean, or Sandy Koufax, or a number of workhorse pitchers in the 1970s were able to do--pitch a boatload of innings and win more than 50 games over a couple of consecutive seasons. But looking over the discussions, it's clear that the contextual problem is mostly historical--no one, so far as we can tell at least, has bothered to quantify two-year win totals for starting pitchers.

So we did it--twice. The first table you see lists the 28 pitchers who have managed to win 50+ games over two seasons since 1901-02.

The table is sorted in descending order of ERA+ for the two-year 50+ win feats; the color coding indicates which pitchers have been inducted into the Hall of Fame (yellow) and which have not (green). The last pitcher to make this list? Denny McLain, in 1969.

The ERA+ sort indicates that the Hall of Fame voters (either front-door or side door) have actually done a good job in distinguishing quality from good fortune. While 18 of the 28 pitchers on the list (64%) have been inducted, 13 of the 14 with the best ERA+ performance in the two-year 50+ win feats are in. The top half in ERA+ has a 93% induction rate; the bottom half in ERA has a 36% induction rate.

Ol' Diz is down in the bottom half in terms of ERA+, but he has something going for him that many of the others on the list don't. What's that? He hit the 50+ win total in three different two-year periods, tying him with Pete Alexander, Cy Young, Ed Walsh, and Joe McGinnity (pitchers from a earlier era, where workloads were somewhat higher) for third place behind Christy Mathewson and Walter Johnson.

What we really need to see, however, is the full historical record. We can guess that the high win total for each two-year period has dropped off over time, probably right down to around 40 from a high point in the mid-60s (during the early deadball era). A yearly breakout will give us a better sense of how two-year peaks (both in terms of wins and ERA+) translate into Hall of Fame induction percentages.

So we slogged through the data and the big, long, honking table that runs from here into the next county down the right side of the page gives you a whole lot of data goin' on.

What we added was the #2 in total wins and the difference in wins between #1 and #2. Naturally, the more wins available to a pitcher, the more likely there will be a sizable gap between #1 and #2. In the current day, you can pretty much throw a blanket over the #1 and #2 guys.

Pitchers in bold type are in the Hall of Fame. When we look at the 110 leaders in two-year wins, we see that Hall of Famers have been the leaders in 61 seasons. When we find the last inductee to lead the majors in wins (Steve Carlton in 1981-82), we can see that operating correlation between leading in wins and making the Hall of Fame is at around 75%

Since we're right down in his region, let's note that Dizzy Dean lead the majors in most wins over two years three consecutive times. In 1934-35, he had 14 more wins than the nearest pitcher (Hall of Famer Carl Hubbell). He did not lead the majors in ERA+ during any of those seasons, however.

The overall ratio of leader years by HoF members to overall seasons where they lead in ERA+ is a bit lower than in the win column--52 out of 110, or 47%.

The boxes around the data in selected years highlights the incidence of seasons where the wins leader is also the leader in ERA+. This occurs in 33 of the seasons, or exactly one-third of the time. 19 of these were achieved by Hall of Famers (57%).

We're right in Koufax territory, and we can see that Koufax led the league in two-year ERA+ four consecutive times. The only pitcher to beat that feat is Walter Johnson, who led for five consecutive years (from 1911-15).

The leading twin total has steadily dipped since 1901, actually falling below 40 in 1983-84, when our old pal Jack Morris became the first pitcher in baseball history to lead the majors in cumulative two-year wins with less than 40 wins.

There was a good deal of flirting with the 35-win total in the early-mid 2000s, but it's possible that an era of diminished offense might cause the leaderboard to stay above 40 a la the totals in the 70s/80s.

The color coding reflects the level of ERA+. As the chart at left shows, the hotter the color, the higher the ERA+. The very best seasons are shown in purple (>200 ERA+) and pink (190-199 ERA+). There was a great deal of peak pitching in the eleven years between 1993-2003, mostly turned in by four pitchers: Greg Maddux, Roger ClemensPedro Martinez and Randy Johnson.

The chart makes a bit of a case for Ron Guidry, who dominated during the late 70s (with ERA+ in the 170s). Dave Stieb, a fine pitcher whom many folks tout in place of Morris, had a nice little run in the early 80s, but his ERA+ numbers are merely very good, not stellar.

We're currently in an era where the win leaders are a good bit more "decentralized" than was the case in the past, but note that there was a similar stretch right after Koufax' retirement where nine different pitchers led in wins. It's always been a bit on the random side. Such is less often the case with ERA+, where there is a stronger tendency for repeaters.

So what about ol' Diz? Obviously he's a "peak" candidate, and the peak as measured here looks pretty darned good. His ERA+ is a bit soft, but the only others who lapped the field in wins over a two year stretch with greater distance between them and the #2 guy are Walter Johnson, Cy Young, and Pete Alexander. That's pretty good company, even if wins don't mean much. Dizzy is not embarrassing anyone by his presence in Cooperstown.

Monday, February 6, 2012

FROM OUT OF LEFT FIELD

The unsinkable Amelie Mancini, expatriated French artist who came to America in 2006, settled in Brooklyn and discovered baseball, has done it again.

Left Field Cards, a side project obviously concocted to take her mind off the on- and off-field troubles of her adopted team (the New York Mets), has just released its second series of linocut cards that feature an appealing whimsy that's deployed with a tongue-in-cheek primitivism.

The new set is called "Edible All-Stars," and while a few of these players don't quite live up to the noun, they all fill the bill adjective-wise.

More details on Mancini's conversion to baseball can be found in an engaging essay/interview with the artist that appeared late last year on the Mets360 web site. She quickly realized that her allegiance with the Mets was something of a Faustian bargain:

"I finally understood the rules and that the team I picked wasn't an easy choice. (I mean, really, Amelie, how could you not pick the Royals??) By then it was too late, I'd already gotten a Mets tattoo."

Mancini has also completed a series of baseball paintings, but for those of us in the 99% category, owning a complete set in her Left Field Cards is probably the most practical approach. It's hard to go wrong with these colorful cards, which come five to a pack, ten to a series, and are strangely, wonderfully satisfying.

As enjoyable as these first two series have proven to be (the first one, still available, is entitled "Bizarre Injuries"), we must admit to waiting with rapt interest for the release of what's touted to be Series #5, which is entitled "Men With A Van."

I'm sure she'll knock that one out of the park, too. Let's Go, Amelie!

Wednesday, February 1, 2012

ANGELL, CONE AND THE FOUR-FORTY

Long Gone to San Francisco for the tenth annual edition of Noir City, followed by the invasion of the all-too-common cold (a "gift" from the loveliest of colleagues), so we will check the compound sentences at the door and man the Kleenex...

Roger Angell, as envisioned by
David Levine
During recuperation, we've finally cracked open A Pitcher's Story, New Yorker legend Roger Angell's volume on the life and times of David Cone. Published in 2001, the book leaves out Cone's final years on the mound and doesn't touch upon any type of career evaluation--as is often the case with Angell, his focus is as much off-field as it is with the action between the white lines.

The book has a circuitous structure, moving back and forth centripetally from Cone's embattled 2000 season (4-14, 6.91 ERA), the year that quite probably chilled his Hall of Fame chances (more on that later).   As is also often the case with Angell, it seems that the narrative progression is built around his innate sense of shifting tonality--though, here, the range seems narrower and more muted than has been the case in his earlier work.

And there's also a sense of deja vu, as if Angell couldn't keep himself from revisiting the theme of career collapse that he'd so compellingly examined in "Gone for Good," his highly acclaimed portrait of Steve Blass.

So while we don't wind up suffocating from a sense of "been there, done that" (the details of Cone's story add flavors that rescue it from being 100% derivative), we can sense when Angell's narrative suffers from what we are dealing with right now--more congestion than is comfortable.

David Cone--perfection followed by drastic decline...
The book was originally going to be more analytical, but Cone's rapid decline--a descent that, ironically, began immediately after pitching a perfect game on July 18, 1999 (against a team that no longer exists)--made such an approach unfeasible.

As always, Angell is good at psychological portraiture, and his talents don't desert him here. One senses that he has more discomfort with his subject, however, due to the greater age difference between himself and Cone--he references this fact on several occasions, as if to indicate that the "post-modern" sexual lifestyle is something completely alien to him. (It's also clear that Cone didn't want to go into these matters in any level of detail, and it falls to Cone's wife Lynn to provide greater perspective on the impact of his sexual peccadilloes.)

Angell shows the influence of the then-current pitch count craze, raging as it was in 2000, by subscribing to what we might call the "single-game catastrophic high pitch count theory." As was always the case with this approach, it focused on only the few cases where such a high pitch count correlated with a soon-manifested injury. Cone's 166-pitch game was clearly excessive, but there's no evidence that it had any effect on the length or quality of his career. Ironically, Cone reported a significant reduction in arm pain in 2000, the year that was by far the worst in his major league career.

Cone comes across as an interesting personality, and it's actually a bit disappointing to see that he's not doing more with his post-baseball career other than work as a sportscaster for the YES network.

Carl Mays--one pitch from glory...
As for Cone and the Hall of Fame: his collapse after his 1999 perfect game weakened his candidacy via traditional stats. His won-loss record was 178-97 (.647) on July 19, 1999; from then on, he went 16-29 (.355). Pitchers who win 200+ games and have a lifetime WPCT of .600 or higher have all gone into the Hall of Fame (with the lone exception of Carl Mays, whose fatal beaning of Ray Chapman has left him permanently on the outside looking in).

Cone wound up 194-126. By sabermetric measures (we always endeavor to leave "metrics" out of our "narrative" and vice-versa), Cone scores well, maybe a bit better than what's actually the case; but he would not be a bad Hall of Fame choice and he just might get a nod down the road apiece from the Veterans' Committee.

Angell displays his well-known interest in "baseball trivia" (all the while rightly acknowledging that there is nothing trivial in baseball to those who have been captured by it) in several digressions within the book (in fact, the book's structure might best be characterized as a series of digressions). The question that might resonate best with you, dear reader, is the one he dubs the "Four-Forty," and it goes like this:

What players with four or fewer letters in their surname managed to hit forty or more homers in a season?

At the time the book was written, the answer was eleven. That's changed since then. We'll let you cogitate on this one for awhile--and try to solve it from memory, as Angell and his colleagues did--it's a more sporting quiz that way, the treasures of Forman et fil notwithstanding.