Friday, September 29, 2023

QMAX: WEIGHING IN ON WAINO

St. Louis Cardinal mainstay Adam Wainwright survived a calamitous final season, bringing his win total to 200 with a miraculous near-return to form this past September 18th. Indications concerning his stuff--which had been harrowingly absent for yearly a calendar year--were so dire that he almost didn't make his scheduled start.

Fortunately, all's well that ends well for one of the true "good guys" in the game, and a pitcher whose career interruptions have concealed his level of achievement. As we use the Quality Matrix (QMAX) to survey Waino's career in greater detail than has been done elsewhere, let's begin by noting a fact that has also been strangely overlooked with respect to his career.

What's that fact? Wainwright made three successful comebacks from significant injuries, ultimately returning to a level of excellence on each occasion--a feat that is remarkable even in this age of rampant, escalating arm injury (particularly to starting pitchers). He was fortunate to be more of a "pitcher" than a "thrower," even at an early age, which aided him in ways that aren't necessarily available to the more two-dimensional "flamethrower" types.

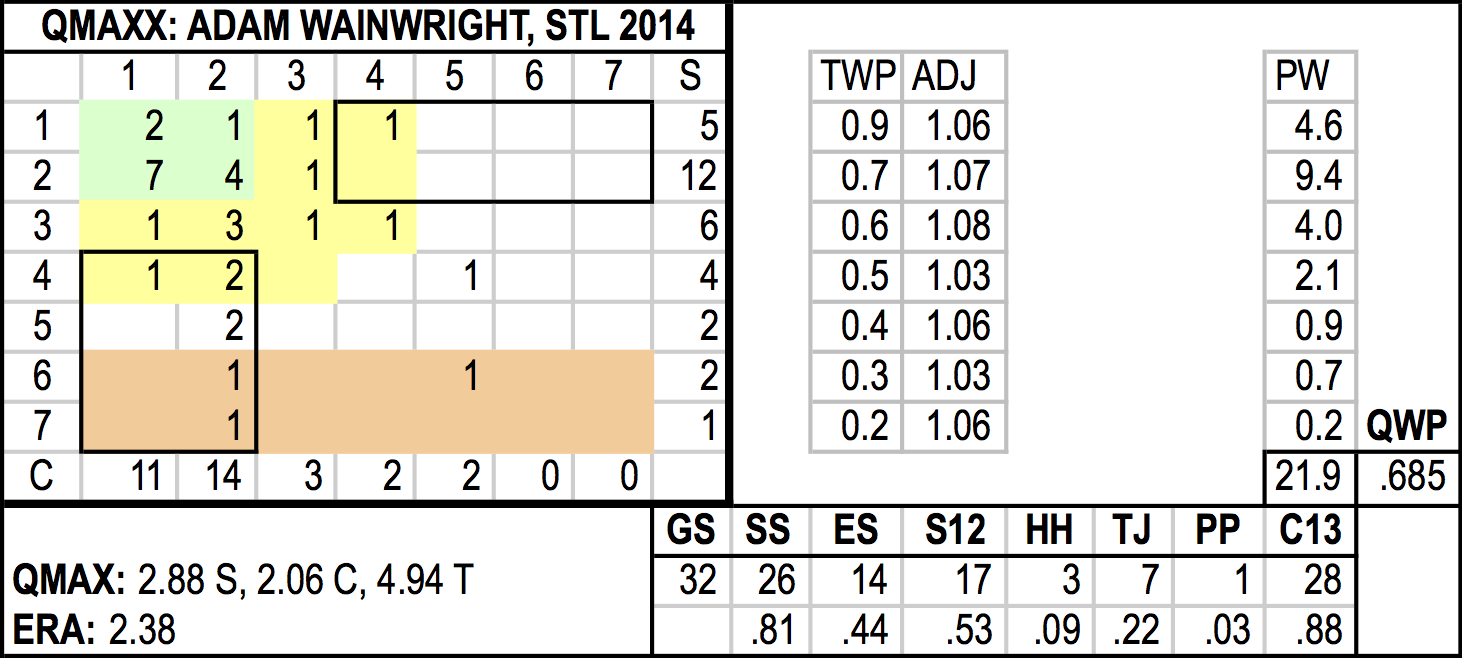
Let's get right into the data for Waino, using information gleaned from Forman et soeur (and then augmented with a newly-revamped and upgraded QMAX):


We are looking only at Waino's starts here, so you'll notice right off that his win total is not 200, it's 198 (the number of wins he achieved as a starter). Over at the right, shaded in yellow, you'll find the special BBB QMAX data, which includes a couple of stats you've probably never seen before (TB/H, or total bases per hit; and TB/IP, or total bases per inning pitched), both of which come into play to add precision to the calculation of the QMAX "S" score, which measures hit prevention.

Before we go further into those added nuances (which will explain some things about pitcher types that rarely if ever get taken into consideration...), let's note the gaps in Waino's career that are somewhat hidden in the above data. 

First, note that there's no line for 2011: that was his first year missed due to injury. It took a year for Waino to regain his form after that, but he led the Cardinals to the World Series in 2013 and had what might be his best overall season the following year.

Then, another injury occurred in 2015--serious enough that many folks feared it would prevent Waino from returning at all. He was a lesser version of himself in 2016 and 2017: a good bit more hittable (with a sharp increase in both TB/H and TB/IP). 2018 began more promisingly, but it wasn't long before he was on the shelf again, which again left his career in doubt. 

But Waino rehabbed well and made it back for 2019, where in the second half of the year he began to round into something resembling his 2009-2014 peak, reeling off a five-game winning streak in September. The delay in the 2020 season due to COVID seemed to have a salutary effect on him as well (except for an uptick in HRs allowed), and he finished that abbreviated year with his lowest ERA (and QMAX "S" score) since 2014.

2021 and most of 2022 were more of the same, as the now-"elderly" Waino was almost as good as new at the age of 40. Prior to another physical setback in September 2022, he had the fifth best ERA+ over a three-year career span from ages 38-40 (124, behind two Hall of Famers--Randy Johnson and John Smoltz--and two other notable late bloomers, Jamie Moyer and Dennis Martinez).

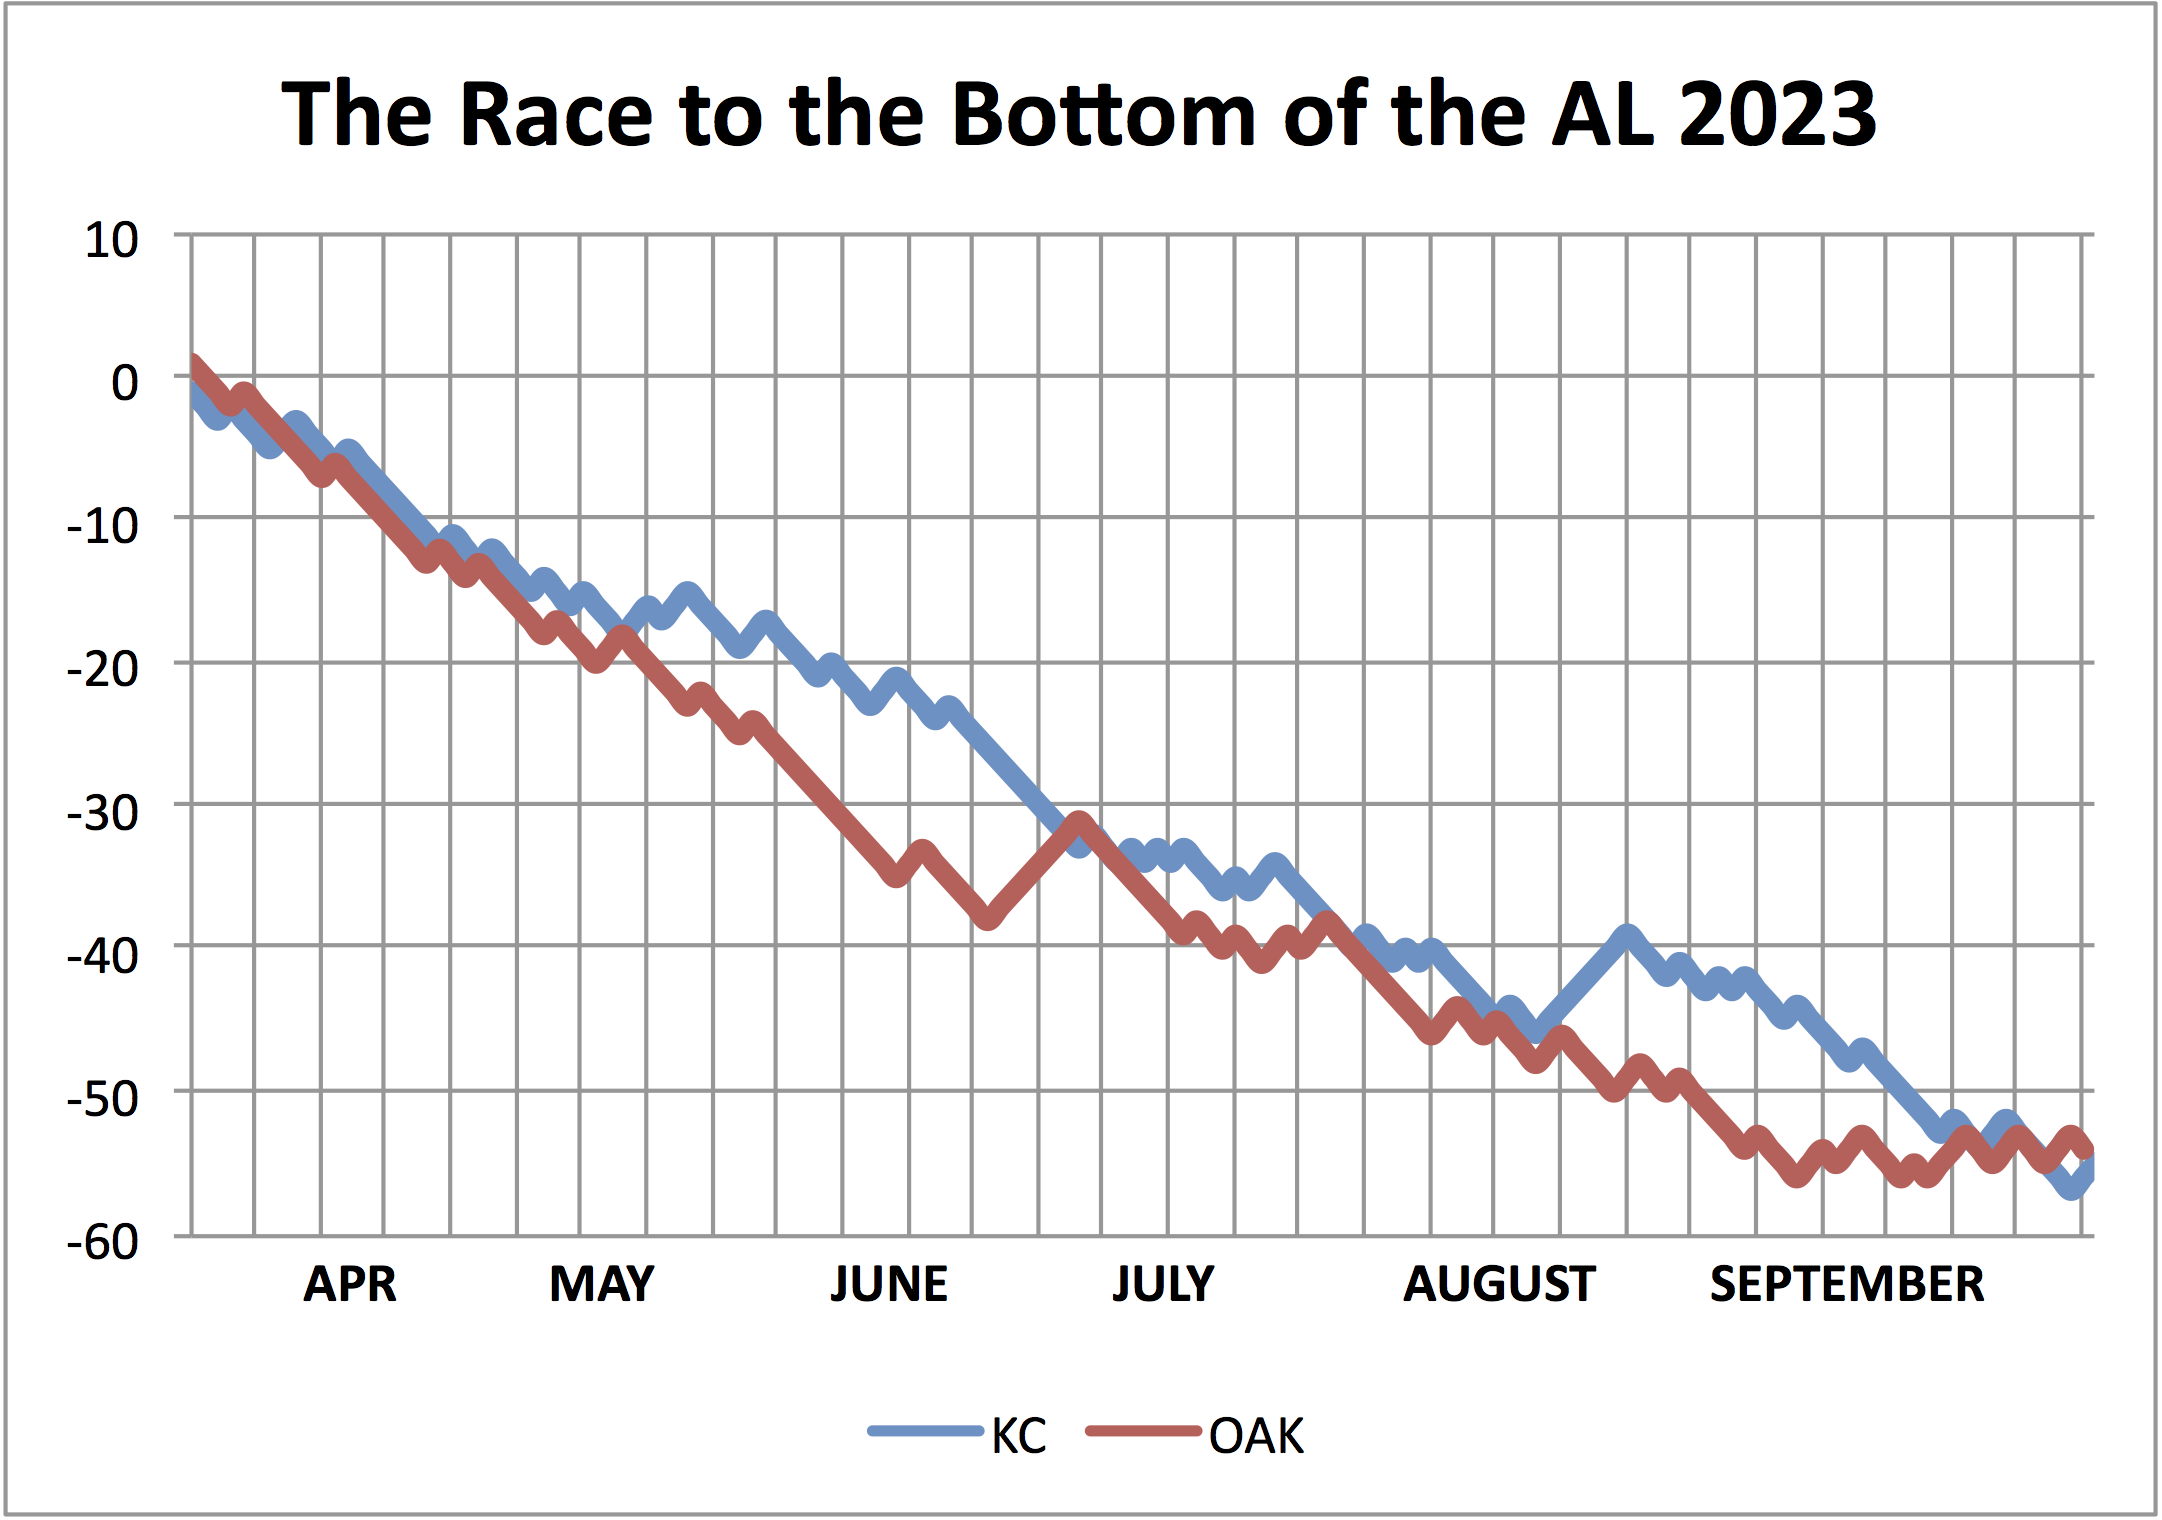
THAT late-season setback in 2022 proved to be catastrophic for Waino--he would never pitch effectively again (save for the miracle game this past September 18th). In 2023--an agonizing season for both him and his team--he hit a wall in late June and lost ten games in a row, jeopardizing what had previously been a superb personal WPCT (sending it spiraling toward .600, a figure we'll return to a bit later). The Cards, committed to their long-time ace, and in a year where it was abundantly clear they were going nowhere, gamely pitched him game after game, in hopes that something--anything--would turn around. 

On August 17th, Waino actually pitched rather well--allowing just four hits over six innings. But the Cards' hitters didn't cooperate, deepening what would prove to be a pronounced second-half slump--and it proved to be his eighth straight loss. Eleven days later, he left the game in the seventh tied 0-0, but the bullpen allowed his baserunner to score for his tenth loss in a row. The two good to excellent performances that Waino willed into existence in September lowered his ERA to 7.40 for the year. (You can see the eerie consistency of his pitching from 9/22 to 9/23 in the first row of data in the master chart with green coloration: it's clear that there was nothing left in the tank.)

AND the contrast in the seasonal matrix charts just above also highlight the night-and-day difference in Waino's performance level. QMAX's "success square" (the green and yellow regions in the upper left of the matrix) is something that Waino hit about two-thirds of the time in his career: in '21, a fine year, he hit it three-quarters of the time. From September '22 on, he hit it only 15% of the time. In '21, he gave up more hits than innings pitched just seven times in 32 starts (about 22%); from September '22 on, he gave up more hits than innings pitched twenty-two times in 27 starts (about 81% of the time). That's about as deep a hole as you can dig and still be pitching in the big leagues.

All of which reminds us how quickly things can change in baseball--how slender the line can be between success and failure. 

The matrix chart for Waino's last 27 starts gives us a sense of what "replacement level" starting pitching looks like while also demonstrating the performance nuances when we place them into the QMAX context. Those twenty-two starts where the "S" score is 5-7 produce a probabilistic winning percentage (what we call the "Quality Win Percentage," or QWP) of .327. Over the course of a 162-game season, that would work out to just about 53 wins. 

It was a sad coda to a brilliant, injury-riddled career: but we can all be heartened by Waino's success in reaching a "magic number" (200 wins) which is presently an endangered species in terms of starting pitcher performance measures. 

Here's one last "contextual QMAX" aggregation for you vis-a-vis Waino's career performance, via a look at the key QMAX regions within the performance matrix. The chart at right shows those regions: the "success square" (delineated earlier) and the "elite square" (the 1,1/1,2/2,1/2,2 "best games"); the two top rows (S1/S2) which contain the top hit prevention games; the converse, in the bottom two rows (S6/S7), which constitute the "hit hard" region; and, most pertinent in the case of Waino, the region we call the "Tommy John" section of the chart, the box encompassing the starts where hits are at least equal and often greater than the number of innings pitchers, the region spanning (4,1 to 7,2) on the matrix, where pitchers manage to win games because the type of hits they give up in such games are more often singles than extra-base hits, thus allowing a higher percentage of stranded baserunners. We've highlighted that data in light blue above, while presenting all of Waino's full seasons (representing 368 games, about 85% of his career starts). As you can see, he consistently lived in the "Tommy John" region, with nearly three times the overall historical average of his starts residing there. (The region also requires excellent control: pitchers who live here do not put extra men on base via the base on balls.) 

This is also why, when you examine basic QMAX S to the more XBH-encompassing QMAX S', you'll see that Waino's S' values are consistently lower (better) in comparison to the basic measure, meaning that all those starts in the "Tommy John" region added value to his overall performance. (It's the nuance in QMAX that is missing from all other evaluation methods.)

It's possible that Waino was the last great exemplar of this type of pitcher: only time will tell if the pendulum within the game will swing back in this direction...

WE'LL revisit Waino's career record when we get into the latter phase of "awards season" at the point when Hall of Fame voting occurs (early January). Keep your focus on the line in the master chart that shows his record from 2007-2015, for that will be one of the key data elements used in evaluating his case for potential enshrinement in Cooperstown.

Thursday, September 14, 2023

BASEBALL'S RACE TO WATCH IS NONE OF THE ONES YOU THINK IT IS...

THE post-season of 2023 is unlikely to have the type of upsets that were so galvanizing in 2022 (at least in Philadelphia). The likely Wild Card teams in the National League are noticeably weaker this year, while the American League will have a strong Wild Card team from the Eastern Division who should have an easier time advancing due to a weak Central Division winner.

Fans in Houston, Dallas, Seattle and Toronto may well sweat things out as the season's final days wind down, but their teams' chances against the Rays and the Orioles look to be slimmer than usual. And rooters for the Phillies, Cubs, Giants, Diamondbacks, Marlins, and Reds will be thrilled if their teams make the post-season, but none of these teams project to get far against the Braves and Dodgers.

And if mediocrity manages to give itself a hot foot, you have the ungainly prospect of a flawed team goose-stepping around in glass slippers. 

SO what to do in light of this looming torpor? Well, of course, there's only one sensible thing available: you need to hunker down and focus on the one truly compelling race going on in baseball at this point.

And what's that? Why, the race for the bottom of the American League, of course...

The A's and the Royals have been locked in a see-saw battle for much of the season, and as we await the Ides of September tomorrow, the two teams are separated by a mere half-game:

OAK 46-100, KCR 46-101

Frankly, the specter of two seriously flawed teams lumbering down the final weeks of the season in what some ways might call "a literal dead heat" is a rare enough occurrence that it should get national coverage along with all the mediocre teams stumbling their way toward the playoffs.

The A's have some intriguing young players (Zack Gelof, Esteury Ruiz, Mason Miller, Tyler Soderstrom) who could form a solid core, but they'll be treading water for a couple more seasons. The Royals continue to be a team that can't draw a walk even if the count on the batter started at 1-0 in every at-bat; their mid-level breakout player Bobby Witt Jr. is another one of these. Whereas the A's have passable pitchers who could form a portion of an acceptable starting rotation behind Miller in Paul Blackburn and J. P. Sears, the Royals' only hope for a bankable starter is lefty Cole Ragans, acquired from the Rangers at the trade deadline. 

Oddly, both of these teams managed seven-game winning streaks during the season: the A's spurt in June caught them up with the Royals, who regained a solid lead over the A's in August with their own streak. Since then, however, the gap has closed, with the A's actually taking the lead again just a few days ago.

What do the remaining dates on the two teams' schedule look like? Glad we asked for you...

ROYALS: Home games vs. HOU (3), CLE (3), NYY (3); Away games vs. HOU (3), DET (4)

A's: Home games vs. SDP (3), SEA (3), DET (4); Away games vs. MIN (3), LAA (3)

The A's would appear to have the slightly easier schedule down the stretch.

WE don't usually have a rooting interest in pennant race matters, as you may recall--there have been exceptions over the years, when certain improbable teams have emerged from obscurity to captivate us in just the right way. Here, however, we're clearly on the side of the A's, for having been one of the early models of "outside the box" thinking in baseball, and for their sustained success in doing so. While we sympathize with Royals players as they endure yet another miserable season, the franchise's stubbornly retrograde approach and their maddeningly flukish success in 2014-15 have always been sore points for us (and, surprisingly, we are not alone in such a perspective, which is a notable rarity when it comes to such matters). 

So we'll just say it once: Go A's.

You should keep an eye on this yourself, just in case the wonky media decides to ignore it all. But, hey, this is a race that could go down to the very final day! (Stay tuned...)

[UPDATE 9/20: Or...not. The A's are trying out more young starting pitchers, and the results have not been good--a five-game losing streak at home (Padres, valiantly trying to sneak into the wild card race, followed by the Mariners, trying to stay afloat in the choppy waters of the AL West and the AL wild card race) and seven overall. Meanwhile, the Royals shocked the staggering Astros by outhitting them and winning two of three, and have caught the floundering Guardians with their offense in the tank. 

So what we appear to be left with are two fumbling Wild Card races that will likely go down to the wire, but somehow manage to seem as though they are occurring in extremely slow motion...]


Monday, September 11, 2023

29-GAME SPANS ≥ TO THE DODGERS' AUGUST: AN EXHAUSTIVE, ELONGATED RUNDOWN...

LAST time we told you about teams that played .800 ball or better over the course of a calendar month (you know: April, May, June, and so on). And we hinted at what's following that up here--a look at all of the instances where teams matched the Los Angeles Dodgers' 24-5 record last month (that's August 2023, in case you're suffering from temporal dislocation).

And so (at left) is the long, exhaustive and elongated answer to a question that none of you (not even Jayson Stark...) had asked.

THESE are all the teams that had a 24-5 (or better) record over a 29-game span (with all of that span occurring during a single season, no "slopovers" from one year to the next). 

There are 116 teams on this list, beginning with the Boston Pilgrims (as the Red Sox were known in 1901) and concluding with the Dodgers 29-game skein (which, unlike most of what you see here, occurred within a calendar month). 

It turns out that there are 191 actual incidences of "24-5 or better" (sounds a bit like an old Chicago song, doesn't it...) because several of these teams had better records during the same year in which they made the list. Many of those "multiple entries" occurred during baseball's early days, when games that ended in a tie were allowed into the official records. But the 2017 Cleveland Indians (you'll find them a good bit further down in the list on the left...) also made the list four times, because they have that many discrete incidences of won-loss records ranging from 24-5 to 27-2--the second-best record ever over a 29-game span, by the way.

For our purposes, however, the 116 teams who did it at least once in a given year is what we really want to know.

AND you're also going to want to know what that darned color-coding means. For once, that's pretty simple:

--Teams shaded in orange are the ones that won the World Series in that year.

--Teams shaded in yellow are the ones that lost the World Series in that year.

--Teams shaded in green are the ones in the divisional era (1969 to the present) who made the post-season but didn't advance to the World Series. 

--And, of course, teams with no shading are teams that didn't make the post-season at all. (Keep in mind that this shouldn't be held against the teams in 1901 and 1902: it's not their fault that the World Series hadn't been invented yet. But the 1904 New York Giants do deserve the blame for not playing in the World Series that year--because they boycotted it!)

As you can see, there have been eleven instances in baseball history where teams with "hot spans" of the type we've defined met in the World Series. But that hasn't happened since 1977.

What seasons produced the greatest number of "hot spans"? The chart gives us the answer: the record for that was set in 1954, when the pennant winners--the Giants and Indians--were joined by the Yankees and Braves as a foursome of "hot span" teams. (The Yankees and Braves would have "hot span" years again in 1957, and that time they did manage to meet in the World Series.)

Years in which three teams had hot span first manifest in 1909, with the Pirates knocking the Cubs out of first place and sending the "hot span" Tigers to their third straight World Series defeat (a feat yet to be replicated, by the way). 

Triple "hot span" teams recur in 1932 (Cubs, Yankees, Senators), 1942 (Yankees, Cardinals, Red Sox), 1951 (Giants, White Sox, Indians), 1953 (Yankees, Dodgers, White Sox), 1977 (Yankees, Dodgers, Royals), and 2002 (Diamondbacks, Braves, and A's).

The summary scorecard for "hot span" teams vis-a-vis the post-season can be seen below at right, where we've broken it down by decade. It's clear that "hot span" teams were more prominent in pre-expansion years, and not just because of the presence of the Yankee dynasty. 

As you can see 72 of the 116 "hot span" teams (62%) occurred prior to expansion (and this is probably our best point for such a comparison historically, since the number of years involved in each time segment is almost the same), with the 1960s proving to be the biggest outlier.

The other strong pre-/post- dichotomy is in the percentage of "hot span" teams making it into the World Series, something that the ever-expanding playoff system will continue to cement in place. 65% of "hot span" teams made it into the World Series in pre-expansion times, as opposed to just 25% since--and that figure is headed sharply downward in the 21st century (3 out of 21, or 14%).

Of course, the silver lining--such as it is--can be found in the number of "hot span" teams that at least reach the post-season. That figure is, as you might expect, climbing in the 21st century--and since expansion the percentage of such teams at least having a shot at the World Series has risen to 82% (11 in World Series + 25 in pre-WS post-season = 36 post-season teams out of 44.

WHICH leaves us (as is so often the case...) on the side of the road, looking at the anomalies: the teams that got hot for awhile, but either couldn't win a pennant or a division--or even miss a wild card slot. Some of these teams are well-known: the 1916 Giants hold the record for consecutive wins, but they finished fourth; the '28 A's couldn't quite stay hot enough to overall the Yankees, but they then reeled off three straight pennants; the '76 Dodgers put a few more pieces together and won two pennants, only to continue their tradition of losing the World Series to the Yanks. 

But there are some truly anonymous teams here as well--ones that never get much attention paid to them because they were also-rans. Who knows anything about the 1916 Browns, or the 1965 Pirates--or even the 2010 White Sox? How about the 1993 Red Sox, who actually finished under .500 (80-82)? Now that we know about these teams, we'll spend some time looking them over; look for a future installment that examines these oddballs...most likely called "Hot Span" Teams As Unreliable Narrators. Stay tuned...

Wednesday, September 6, 2023

HIGH-FLYING MONTHS: THE DODGERS' AUGUST IN HISTORICAL CONTEXT

SO the Los Angeles Dodgers had that white-hot month: 24-5...a feat already fading into a crevasse with the shocking news of Julio Urias' arrest for domestic violence. It's a safe bet that Los Dodgers will not be duplicating their feat (.828 WPCT) in September.

But it leads to a question we've never seen pursued elsewhere: just how often do teams have such high-flying months? Let's set the bar for high-atmosphere flying at a WPCT of .800 or higher. Just how often do you think that teams manage to sustain such a performance level over any given calendar month? And has anyone actually sustained such a level over two consecutive months?

As always, we have Forman et soeur to thank for having that information stored; we'll now unlock it for you. Our TimeGrid™ chart at right shows you just how often this has happened since 1901.

That's a total of 53 times over that span, and we have some color-coding here that adds a more detail:

--An orange-shaded box shows you where teams had two consecutive .800+ WPCT months. (The two teams in question: the 1906 Cubs and the 1912 Giants. Oddly, both lost the World Series that year.)

--A green-shaded box shows you the years in which the New York Yankees had such a month. (That's right, they haven't done it since 1941.)

--Blue-shaded boxes show you baseball's expansion years, which somewhat surprisingly were not collection points for high-flying monthly performances. 1977 was the only expansion year in which teams flew up and over the monthly .800 WPCT barrier--and one of them was the Dodgers, doing so in a league where there were no expansion clubs ('77 was AL expansion only). 

--When you see a number in red type, it's a high-flying month where the team's ERA was 3.00 or higher. And when you see a number in bold red type, it's because both teams who flew high did so with a 3.00+ ERA.

Note that more of these months occurred in pre-expansion times: 33 in sixty years (1901-60). In the sixty-three seasons since, it's happened only 20 times. 

NOW let's take a look at the actual teams who flew high for a month. We've broken the lists up by pre-expansion and post-expansion just to help you keep your eyes from glazing over...

On this chart, we show you the post-season status of the high-flying team:

--Those with boxes around their team abbreviations were World Series winners.

--Those whose team abbreviations are shown in red are teams that failed to make the World Series.

--Those teams with abbreviations in orange didn't play in the World Series because the World Series hadn't been invented yet!

So just 13 of 33 teams with high-flying months during the pre-expansion era went on to be World Champs. That doesn't sound all that great (39%), but as you'll see, it's a helluva lot better than the post-expansion percentage...

Because of the ever-increasing amount of post-season play, it's become harder and harder for teams with high-flying months to actually win the World Series. In fact, in the past sixty-one years (1961-2022 minus 1994...) it's happened only once: the 1984 Detroit Tigers. Only five of the eighteen teams who've completed a full season and had a chance to make it the World Series have done so (we can't add in the 2023 Dodgers and Braves, whose season isn't over yet). 

Oh, and forget about that extra shading on the 2013 Rays...just another friendly goof!

NOTE that the Dodgers have had high-flying months in consecutive years (2022 and 2023). Only the 1912-13 Giants, the 1938-39 Yankees, and the 1942-44 Cards have managed that. And only those Cardinals have managed to have three consecutive years in which one of their monthly WPCTs exceeded .800. Small solace to those St. Looie fans enduring a dismal year in '23, perhaps, but we should never look askance at a singular achievement. 

The accompanying stats are geared around pitching performance. (Getting the hitter data is a more arduous task, but we'll dip into it when some of our other obligations are less obbligato.) Note that the highest ERA for a high-flying team occurred in 1950 (the Boston Red Sox). Only one other team has had a team ERA over 4.00 and had an .800+ WPCT in a month--the Milwaukee Brewers, in April 1987. Fittingly, neither of these teams made the post-season.

We'll be back with a look at high-flying performances in 29-game spans not strictly tethered to the calendar (in other words, 29-games spans that cross over monthly boundaries). There are lot more of those to sift through, so brace yourselves...

Sunday, September 3, 2023

UPDATED MONTHLY PITCHING SUMMARIES THROUGH AUGUST--NATIONAL LEAGUE

Until the AL had its offensive surge after the All-Star Break, the NL was clearly the "hittin' league" in '23. That's for better and for worse, since we've always associated the league that held out against the DH as being the place where we'd see more pitching. So much nuance lost, so little time: someone really needs to slice up the Tango Love Pie™ and toss it in the trash can...

BUT let's not dwell on that when we can sift through some data, even if it has been somewhat compromised by the specter of 21st century reductio ad absurdum. The numbers, if handled in something more akin to the old-school way, still have some tactility to them, and we've got to protect that at all costs against the blowhards building their "empires of exit velocities." So let's let our fingers do the walking in the agglomeration of monthly pitching data, starting with the NL Central:


The Cubs have manage to overcome their May bullpen disaster and play solid ball for the past three months (47-31 from June 1st to the end of August). Their starting pitching is still a bit suspect, however, and they aren't really ready to go very deep into the post-season even if they make it. 

The same can be said about the Reds, who've brought virtually an entire farm system to the majors in '23. The Pirates and the Cardinals have floundered all year, with the Bucs squandering a promising start (just 41-64 since May 1st) and the Redbirds having both components of their pitching shoved down their throat serially and consecutively.

The Brewers remain the only really solid team in the NLC, but they'll need some breaks to get by the league's big guns in October. Now let's look at the NL East:


The Mets' fire sale produced the expected results in August, and brings their '23 season to its "not with a bang, but a whimper" moment. (Oh, and Tommy Pham DID get dumped: he wound up in Arizona, which is probably not his last stop).

The Fish have flopped themselves out of the water after their glorious June (19-32 in July and August) and have stopped gasping for breath, while the Nationals had a two week hot streak (11-3) against cratering clubs that gives them a better result in August than what is really the case. 

Comparing the Phillies and the Braves from June 1-August 31 is more interesting than one might first think, given how on fire Hotlanta has been: ATL 54-22, PHI 49-29. The Phils' starting pitching is actually better than the Braves' at this point, which could make for some interesting occurrences in the post-season should the two teams ultimately collide.

Now it's flyover time, headed back to the West:


The Diamondbacks' starting pitching failed them first; then the bullpen went kaput as well, making them into pretenders instead of contenders. The Padres' bullpen has a collective 8-25 record since May 1st, which has proven impossible to overcome. 

The Rockies are an ungodly mess, with starting pitching that almost makes Oakland's look "good" by comparison (Rox SPs are 23-59 for the year, 10-32 since June). 

We got a little giddy last time about the Giants and Gabe Kapler's "Tampa Bay tiered" pitching staff, but SF is still in the hunt for the third wild card slot, and if the starters can regroup in September, they just might make it. 

The Dodgers were able to put a bandaid on their pitching staff after a rough July for their starters, and they got an historical performance out of Mookie Betts in August to boot, lifting them to a 24-5 record for the month. (We'll cover "great team months" in more depth later this month...) It would have looked even better if Tony Gonsolin hadn't been left in to shred his ERA and his arm...

That said, their current crop of starters don't really seem likely to stop the Braves should it come down to that matchup in the NLCS. 

We will (of course) wrap up these monthly looks right after the season concludes. Stay tuned...

Saturday, September 2, 2023

UPDATED MONTHLY PITCHING SUMMARIES THROUGH AUGUST--AMERICAN LEAGUE

August continues to be the month within the baseball season that tends to shake out the relevant results in the brand of "post-season baseball" we now experience. 

We see teams rise or fall in more definitive ways during this month, leaving some wiggle room for the cadre of Wild Card contenders; and August 2023 is right in the pocket WRT this, particularly in the American League, where one division (the Central) is so crippled in comparison to the others.

The pitching summaries we've devised from data found a Forman et soeur (aka Baseball Reference) give us a solid suite of relevant info for showing how teams rise to the top--which they do primarily through getting the two segments of their pitching staff in sync. Let's go ahead and move right into a look at those AL summries, beginning with the Central Division:


Our color coding is more robust this time around (though it's doubtless missing something...) and we can see right off that the White Sox' sell-off at the trading deadline cemented in place a totally disappointing season for South Side fans. Three out of five months where starting pitchers have an ERA north of 5.00 is going to produce catastrophic results (and the White Sox' record in those three months was 25-54...not quite the uber-disaster experienced by the A's and Royals, but sufficiently bad for the fan base to spend much of its time at the ballpark holding its collective nose).

Cleveland spent the year with an up-and-down pitching staff racked by injuries--the silver lining might be that they did bring a number of promising young starters up in '23, giving them a solid amount of experience that might serve them well for next year. Their last-gasp waiver wire play brought them three more pitchers for an ostensible September "Hail Mary," but only one of those pitchers was a starter (Lucas Giolito)--and a struggling one at that.

The Tigers settled into a fitful mediocrity after the All-Star break, and their arduous sorting-out process is likely to continue well into 2024; the Royals achieved a lamentable consistency this year, in that in every month thus far the two segments of their pitching staff have had a losing record. Perhaps September will break the spell--but don't hold your breath.

Minnesota continues to lurch toward a division title, but their pitching has gone mediocre since June and it will be a miracle if they win a single playoff game.

On to the AL East:


It's turning into one of those rare-but-blissful years where the customary "big bruisers" in the Eastern Division (Yankees, Red Sox) seem all but certain to miss the playoffs. Bad pitching in July put the Yanks behind the eight-ball in July; then anemic hitting sunk them further in August. The Red Sox' bullpen, which had seemingly rounded into shape in July, cratered this past month, pushing them back down the standings.

The Rays recovered from their swoon in July, thanks in part to a vulturous bullpen (9-1 for August). They were still passed by the Orioles, who are currently the only team in the AL with a winning record in every month. Despite adjustments to their pitcher personnel that paid off handsomely in both July and August, there are still some folks who have their doubts. We're rooting for them, however--despite their medieval team ownership...

The Jays have had solid pitching for three straight months, but they just don't seem to generate sufficient momentum that can get them into the race. They'll have a dogfight on their hands to claim a Wild Card berth...but don't count them out.

And now to the Wild West:


Talk about a dogfight: the two Texas teams and the Mariners are now neck-and-neck, and September head-to-head match-ups will be extremely interesting. The Astros' bullpen seems to be returning to form just in time to help them, but they're going to need more consistent starting pitching. 

Seattle and Texas seem to have their pitching staffs in solid shape heading into the stretch run, though the Rangers have been more up-and-down and still have some bullpen uncertainties.

The Angels simply crashed and burned, so much so that we missed the blue color-coding for their component performances in August (there should be blue--which is the code for the worst; orange--no longer the new black--is the best). Truth told, their pitching was always iffy, and Shohei Ohtani's injury was the poisoned last "flavor straw" that leaves yet another scent of ash in Anaheim.

The A's starting pitching is something not to behold. Add up that won-loss record and you'll be looking for a bed to crawl under: that's right, that end-of-August total was 13-60. But they're playing the Angels this weekend, and their starters are 2-0 in September. Better take a snapshot of that quick...

We'll return with the NL summaries maƱana. Stay tuned...