Thursday, March 30, 2023

AN OPENING DAY TRIFLE

 A very happy Opening Day to you (even if you are reading this after Opening Day). There is so much media--seemingly more than ever before--floating around about the beginning to this particular season, that it can seem...and, in fact, is...overwhelming. 

We'd have suggested that those in-your-face timing rules get modified to 20 seconds for bases empty and 25 seconds with men on base, but that solution is (of course) too simple for the "Ivy Leagued" systems analysts who are the purveyors of "change" to the game this year, as the attempt to give baseball a facelift continues in earnest. What will not change, however, is the outsized emphasis on isolated power ("launch angle") which may be moribund for the theoretical "vanguard" but is still all too much in play as the 2023 season begins. 

While all of that (and stolen bases and the shift yadda yadda yadda) begins to play out, here'a a trifle for you to enjoy that's related to Opening Day as a kind of predictor of what happens at the back end of the season. We say a "kind of" predictor because we don't want to oversell it--this is just another excuse for one of our TimeGrid™ charts to dazzle your eyes and keep our trademark intact. So here goes:

This answers the question (which you know you wanted answered before you even knew what the question was...) that concerns the performance of World Series winners on Opening Day. How many teams that won the World Series also won the first game of the regular season?

This TimeGrid™shows you who did and who didn't (even if it doesn't also tell you the actual World Series winner--you'll just have to trust us when we say that our data is accurate). The Boston Americans in 1903 won their first game before going on to win the first World Series. Likewise for the most recent champ, the 2022 Houston Astros.

In between, they were joined by 74 more teams who have a match between first game of the season and World Series victories. That works out to a match in 65% of the instances. You can see the decade by decade totals/percentages in the columns at the far right; the yearly totals and percentages (years ending in 0, 1, 2...9) are shown in the rows at the bottom of the chart. 

Note the 70% and 61% figures in the lower right. The former represents the percentage of matches for the teams that played from 1903-60, or the pre-expansion era. The latter gives you the percentage of matches for the expansion era (1961-present). 

That match has taken a bit of a hit because there was a real downturn for this "correlation" (more like a superimposition, actually...) around the turn of the century (20th-to-21st). From 1998-2012, only five World Series winners out of fifteen (33%) also won on Opening Day. 

And as the color-coding shows you, the later years in a decade seem to slough off in this regard as well. If the year ends in "8" or "9", the World Series winner is also an Opening Day winner in only 46% of the instances. 

As noted, this is just a trifle that ties together the beginning of the season with its end--which will be here sooner than we think. It certainly won't help you pick the '23 World Series winner, but you might just find yourself interested to look at the playoff teams to see which ones either won or lost on Opening Day, since there is about a two-thirds chance that one of the Opening Day winners is going to be the World Champs. We'll let you know when the time comes...

Sunday, March 26, 2023

THE TOP 600 HALF-SEASONS/15: BABE RUTH (THE BIG THREE/#1)

Today is my late Dad's birthday, and he was just old enough to have had the opportunity to see Babe Ruth play in person. He saw him several times: the first was on a barnstorming tour through the Midwest just a couple weeks after the stock market crash that ushered in the Great Depression. Ruth took the mound that day for an inning or two, and my Dad remembers him as still being rather spry. He did not hit a homer during the exhibition game, but he put on a good show in batting practice.

Stats were not kept at the obsessive level of detail that is now the case, so it's likely that neither my Dad nor Babe Ruth knew just how thoroughly he was going to dominate a future compilation of hitters' "half-season stats. As we've been demonstrating here, it's relatively easy to assemble such data now, and (as you might expect), the Bambino has the most "half-seasons" in the Top 300 on either side (1st half/2nd half). Take a look:


In case you don't want to count these up by hand, there are 25 "half-season entries" in the Top 600 (or, rather, Top 300 for each half) that have Ruth's name attached to them. Notice that his season-long dominance in so many seasons results in eleven years showing up in both 1st half and 2nd half leaders lists. (Those years are: 1919, 1920, 1921, 1923, 1924, 1926, 1927, 1928, 1931, 1932, and 1933.)

The Babe was (of course) the first hitter to slug 30+ HRs in a half-season (that happened in the first half of 1921). He would do that again in the second half of 1927, the first half of 1928, and the first half of 1930.

Ruth has seven seasons in the Top 10 of "half-season" hitting achievement (as measured by OPS+). His #1 and #2 half-seasons occurred in the same year (1920), when what he was doing was still radically innovative. He had another six seasons in the 11-through-20 slots, the first of these coming in his final half-season with the Boston Red Sox in 1919; the final one occurred in the second half of 1932.

The Babe finally started to show his age in 1933--he was 38 years old, after all, and he just wasn't able to lay off the type of food that had laid him low back in 1925 (the infamous "year of the tummy ache"). 1933 was the year in which my Dad saw Ruth in an official major league game: the date was June 30th, the place was Cleveland.

He remembered it vividly even seventy years later, and when you look at the box score at Forman et fils (OK...Baseball Reference) you'll see why. The Yankees were defending World Series champions, but they were in a dog fight at that point of the '33 season with the Washington Senators, who would ultimately march to the AL pennant that year thanks in large part to a 13-game winning streak in August. It didn't help the Yankees that their second-line pitching was less than mediocre that year--which contributed to their 1-9 record in extra-inning games. 

Ruth had three hits (all singles) in that game, driving in three runs, but my Dad recalls that he had much less mobility at this point that had been the case four years earlier. Old and out of shape, Ruth in the second half of 1933 saw his batting average slip below .300 for the first time ever. (He'd hit below .300 for the entire '34 campaign, his last full year in MLB.) Thanks to his batting eye and still relatively prodigious slugging, he still wound up in the outer reaches of the Top 300 for both halves...but, save for that legendary three-homer game against the Pirates in '35, it was the last hurrah.

We'll be anthologizing more of our "wraparound seasons" (the full year's worth of data soldered together from the second half of year A and the first half of year B) in an upcoming post, so of course we're going to show you the ones that belong to the Babe. As with everything Ruthian, they are fascinating:


What tends to happen here is that many of Ruth's iconic early seasons with the Yankees (1920 and 1921 in particular) get a bit flattened out when they are given the "wraparound" treatment. He gets a tad closer to a .400 BA season in the 1923-24 wraparound (he hit .393 in '23), and he's very consistent in the 1926-27 wraparound, with a little more SLG in the '27 portion.

What's really noteworthy, though, is the uptick in power that Ruth demonstrates in his next two wraparound seasons that both crack the Top 600. Note that after he hits 31 HRs in the second half of '27 to reach that still-magic number of 60, he then hits 32 HRs in the first half of '28 to fashion a wraparound season where he actually hits 63 HRs! (Aaron Judge will get a shot at breaking that record in the first half of 2023; it will be an uphill climb.)

And note that the Babe hit 60 HRs again in the wraparound season of 1929-30.

One of the last conversations my Dad and I had centered around Ruth. He allowed as how a player like Willie Mays was possibly more "exciting" because of his defense and speed, but he remembered how the hush came over the crowd in Cleveland Stadium in 1933 when the aging Ruth came to the plate. "People couldn't take their eyes off him," he said. "They didn't want him to do damage to their home team, but they really wanted to see him get hold of one." 

But while Ruth hit .372 with 46 HRs at Cleveland's League Park from 1915-32, he didn't hit a single HR in Cleveland's new park, debuting in the first year of the New Deal. (My Dad took solace in recalling that three years earlier, while visiting his grandparents in Cleveland, he'd been in attendance when the Indians' Earl Averill had hit three homers, with a chance for a fourth in the seventh inning. Averill didn't get it, but he won over my Dad, who became a devoted fan and was overjoyed when his first "big league crush" was inducted into the Hall of Fame.)

Happy birthday, Dad: I miss you and think of you often. And long live Babe Ruth--as in...forever.

Sunday, March 19, 2023

BB≥H: TRACING MORE TRACE ELEMENTS IN "OFFENSIVE SHAPE"

Babe Ruth sends his regrets regarding his coming-out party as the king of both halves of the baseball season--he's tied up right now. (Dontcha know that those bondage freaks come in the most unpredictable sizes...)

SO this time we're going to look at something more quirky than kinky: an arcane but fascinating (trust us!) sub-realm that Babe Ruth was born to inhabit, but somehow never did.

The beauty of this particular digression from our ongoing series (at least as far as we're concerned...) is that it takes us way, way back into the game's history--in fact, almost back to its dawning. Almost--but not quite: let's take a look at yet another of our TimeGrid™charts (at right) to get a sense of just how often our "trace element" within the sub-universe of a player's "offensive shape" has occurred over time. (Note that we're being extra cagey by not even bothering to label the data we're showing you...but fear not, all will be revealed.)

THIS chart agglomerates all of the seasons where one or more hitters had more walks than hits. (We cut off eligibility for this list via playing time: anyone with 300+ PAs and at least as many walks as hits is captured here, in the decade (column) and year.

If you've been here before and haven't yet thought better of it, you'll know that we've written a lot about "walkmen" during our checker(board)ed career. (We love guys who walk a lot.) Think of the folks represented in the numerical distribution above as the "uber walkmen" at the furthest reaches of the "work the count" spectrum. (The average walk percentage, or BBP as we abbreviate it, for the 93 player-seasons in this special little tribe of hitters is 21%, about two and a half times the historical average for MLB.)

Since we endeavor to avoid extra-lengthy posts, we won't provide a detailed accounting of the players on the list. But here are some highlights. The first of this type was William "Yank" Robinson, one of only two players to have BB≥H in four consecutive seasons, from 1888-1891. (We'll let you think about who the other player might be.) Changes in the game and the coming of the Deadball Era stopped "uber walkmen" in their tracks for about thirty years, save for Tony Smith (an obscure infielder with 500 lifetime PAs who is the only player with a lifetime record of BB≥H (95 walks, 90 hits) and the much better-known Jimmy Sheckard, who found "walk religion" at age 32 and who had BB≥H for the last three years of his career.

BB≥H guys might have remained this rare until the advent of the "four Eddies" (Stanky, Joost, Lake and Yost) in the 40s save for the Philadelphia A's Max Bishop, the record holder for most BB≥H seasons (six: 1926-27, 1929-30, 1932, 1934). Well-traveled Roy Cullenbine was the first "uber walkman" to emerge in the 40s, with more power than the folk who'd preceded him, with a career cut short by the prevailing gap in understanding of the value of OBP over BA. He was followed by the aforementioned foursome, who weren't particularly fearsome, merely pesky. (And there is a Johnny Pesky season to be found here, in 1952, a decade in which he is increasingly surrounded by folk with more power--Aaron Robinson, Wes Westrum, Earl Torgeson.)

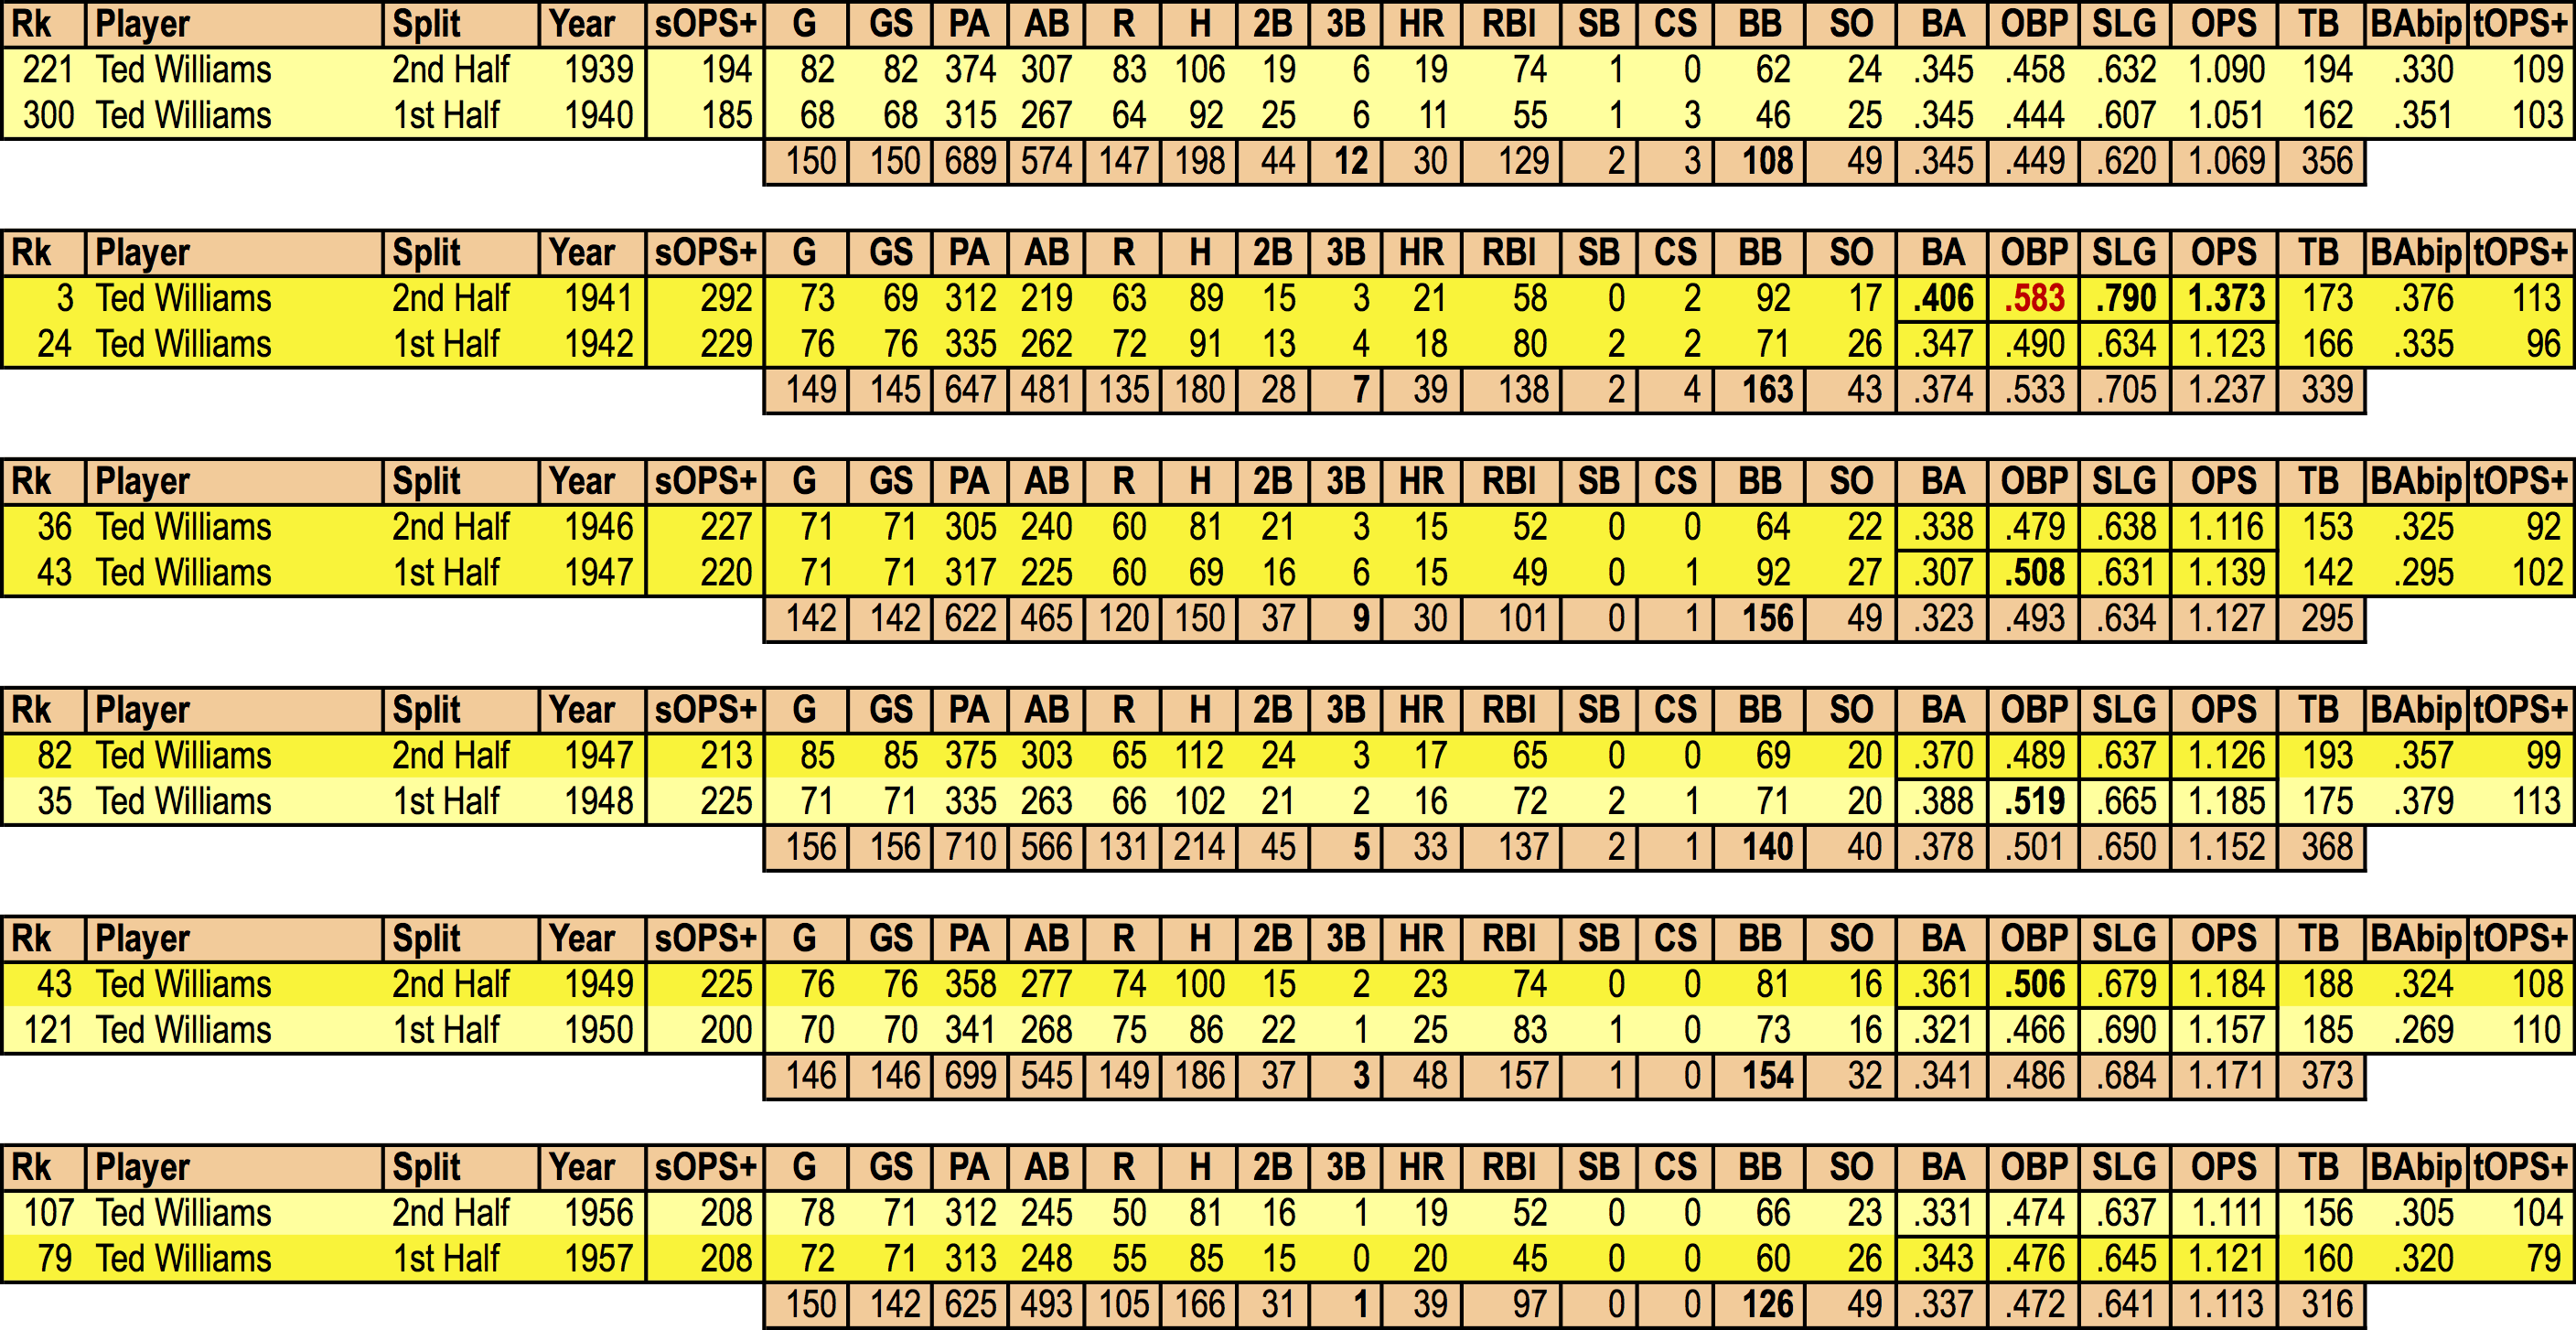
The first "superstar uber walkman" appears in 1954, in the form of none other than Ted Williams. He's soon followed by Mickey Mantle, who has two such seasons--1962, when he's at the tail end of his peak, and 1968, at the tail end of his career. Another Hall of Famer, Harmon Killebrew, also has a BB≥H season in 1968, in what was a really down year for his BA.

As you can see, this "trace element" within the game finds a way to persist at the edge of extinction for the next four decades from a continuing variety of "uber walkmen" subtypes. It's a kind of validation that at a subconscious level, baseball is not calcifying itself into the type of game where unorthodox combinations of offensive production are not automatically shunned. 

But as baseball morphs itself toward a game favoring isolated power, the types of hitters who populate the BB≥H subgroup begins to shift toward a certain class of low-BA slugger, which leads to a veneration of that type of hitter whether he can draw a lot of walks or not. Hence in the 70s you see the list of names shift from folks like Dennis Menke and Wayne Garrett to Gene Tenace, Otto Velez, Ken Phelps, Rob Deer. The last of the former type of these "uber walkmen" to make an appearance is Lance Blankenship, who had a brief career as the "Max Bishop of the 90s" with the same franchise (only now on the opposite coast in Oakland).

"Superstar uber walkmen" became much more commonplace in the 70s and 80s (Willie McCovey, Jim Wynn, Jack Clark) and this continued into the 90s with Mark McGwire and Gary Sheffield. The ultimate "superstar uber walkman," of course, spread himself over the 2000s in a way that still produces malingnant memories for many folk: that would be Barry Bonds, who matches Bishop for the most BB≥H seasons (2001-04, 2006-07) and ties Yank Robinson with four consecutive seasons in this rarefied company. 

Some lesser sluggery types (Adam Dunn, Jack Cust, Morgan Ensberg) accompanied Bonds as the 2000s kept on producing a semi-robust number of BB≥H seasons, but things have dissipated in the 2010s, as quants followed the lead of neo-sabes and continued the push toward ever-increasing ISO as the "one-stop shopping" model for run scoring. 

That's troubling news, of course, but it's just another sign of the times. We do have four BB≥H seasons in the short span of our current decade, however, but these are not likely to lead to a new lifeline with respect to this ever-endangered species. There are still no low/mid power guys hitting .250 and walking 20% of the time: guys like Stanky and Ferris Fain seem to have gone the way of the dodo bird. Now we have Yasmani Grandal (close to the target sub-type in his '21 season, but too much ISO) and Joey Gallo (whose .160 BA creates a lot of backlash in a timeframe troubled by the decline in BA even as quants decry the need to measure it anymore).

Finally, there's Juan Soto, a true anomaly: a young superstar who had a not-quite "superstar uber walkman season" at the tender of age of 23. Clearly Soto has a great batting eye, but 
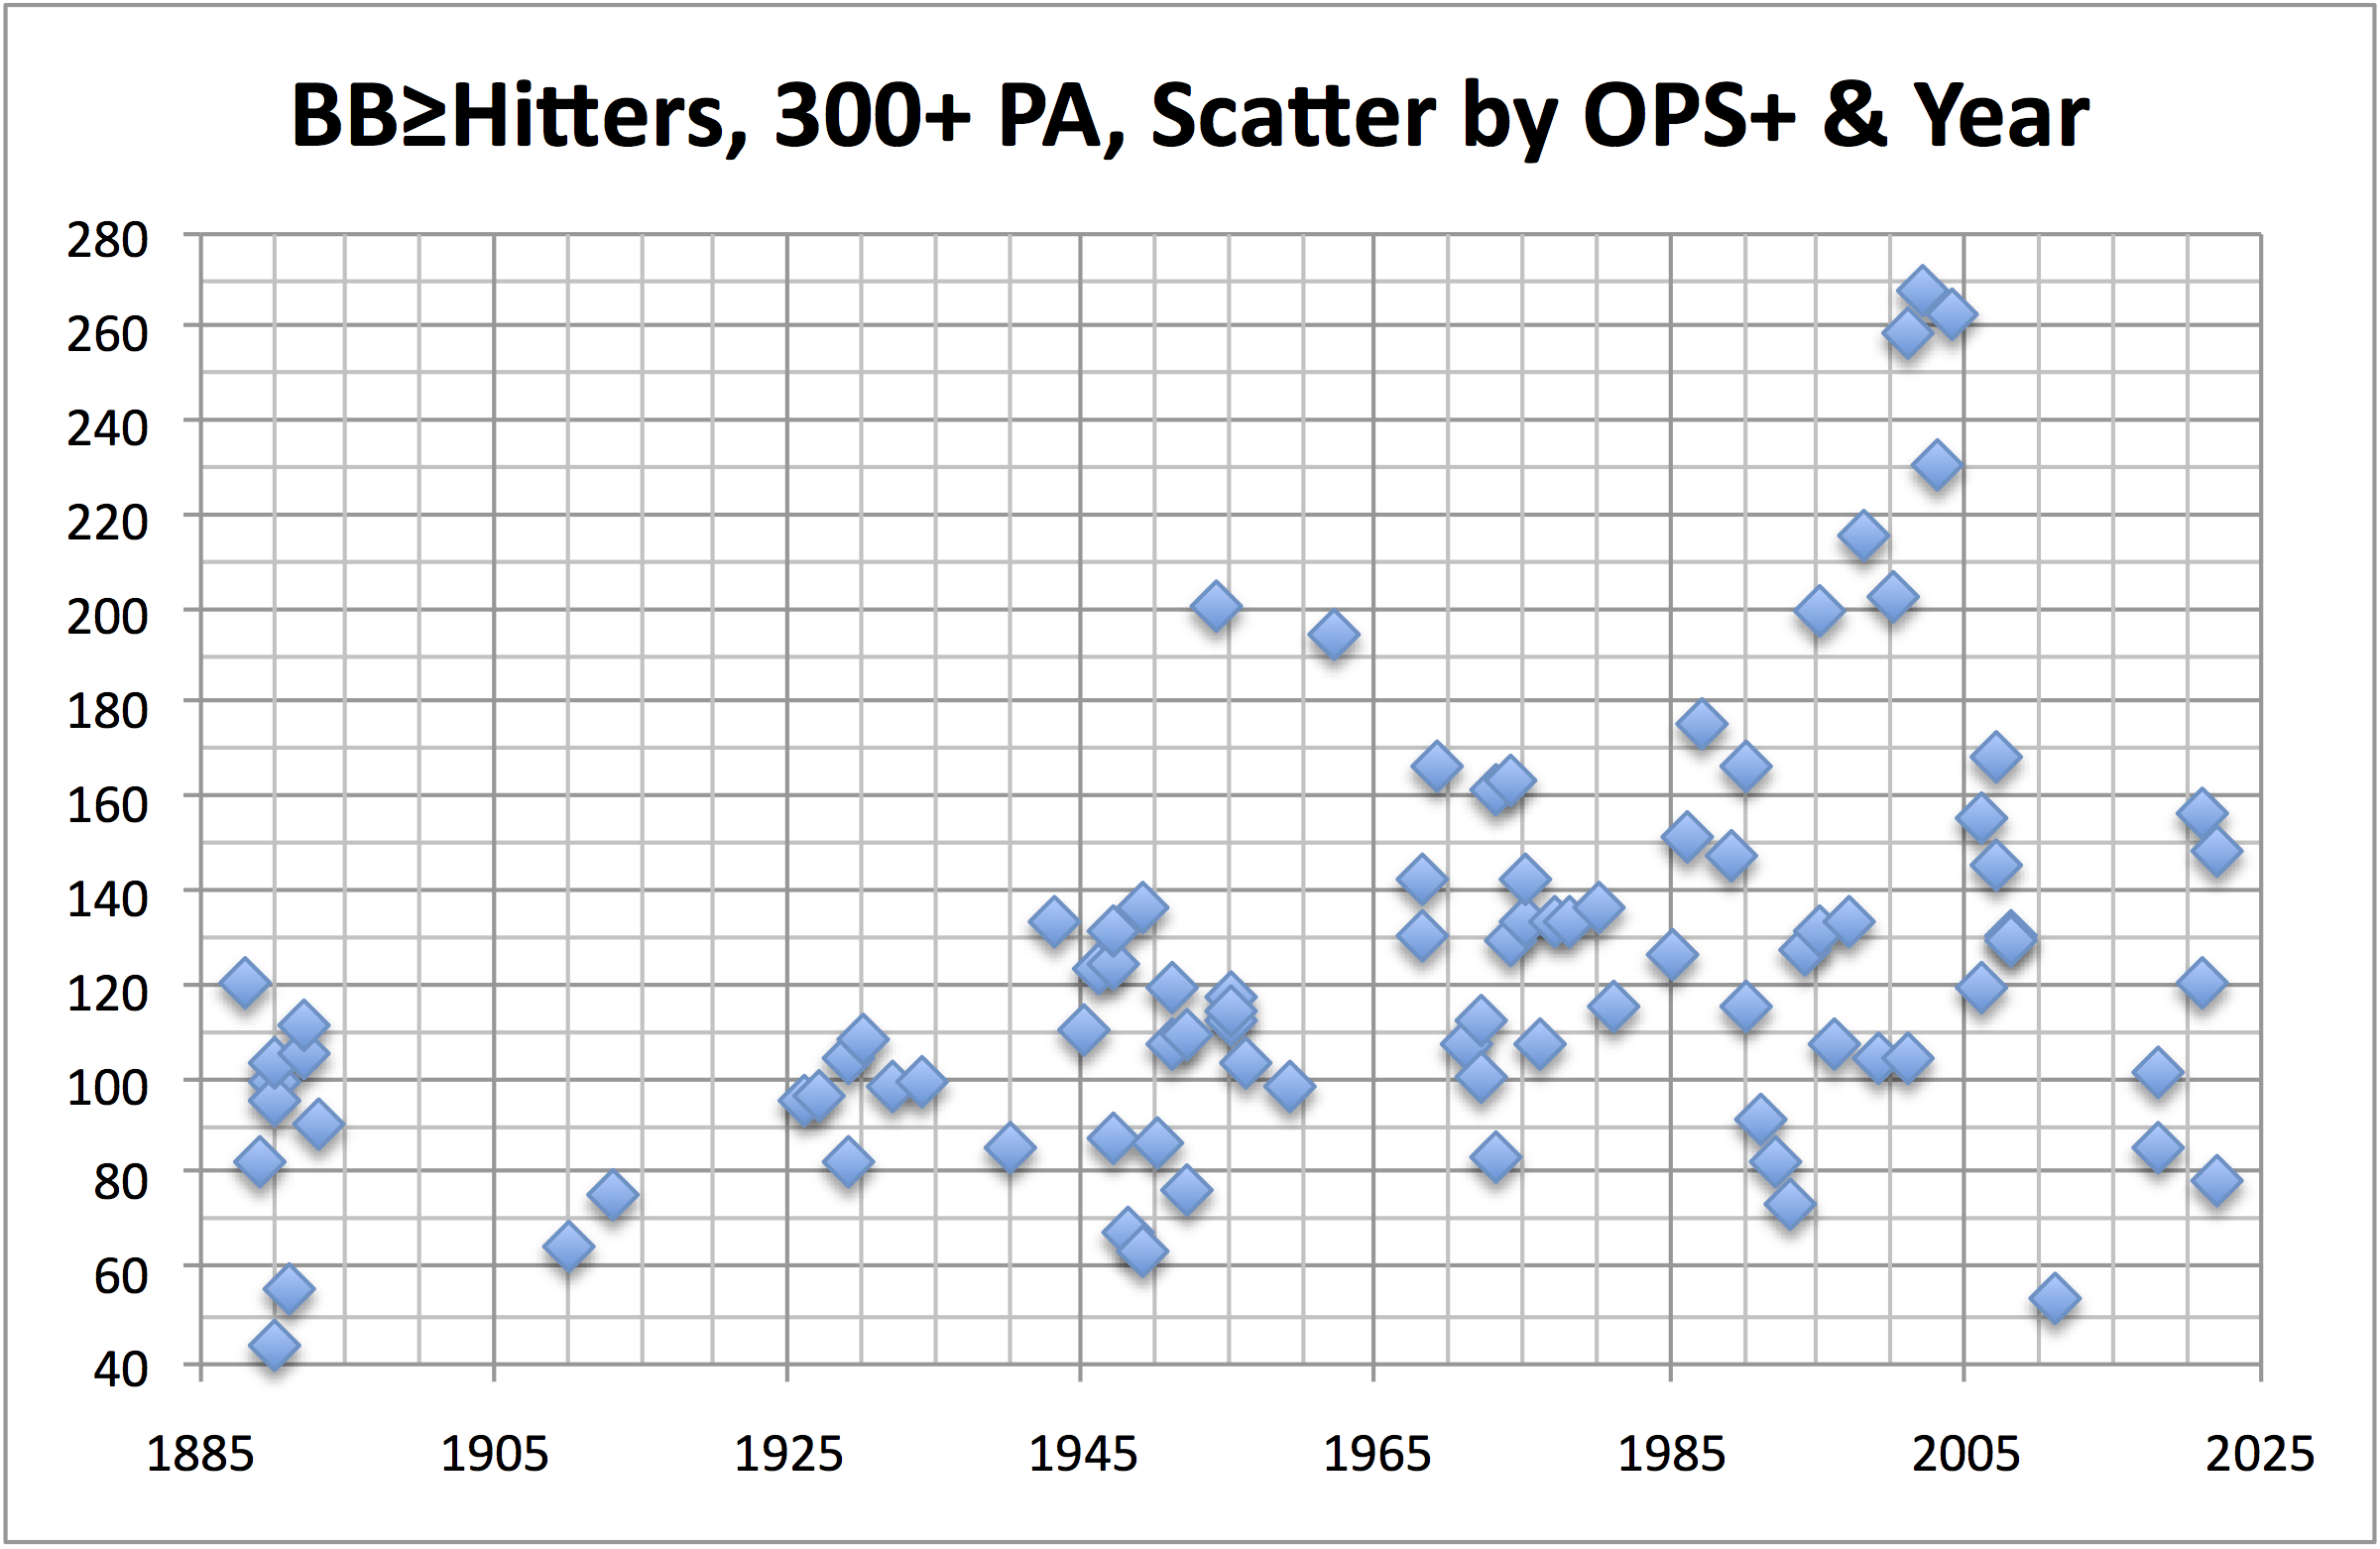
the chart at left shows that the vast majority of players who populate the BB≥H subworld are folks on the other side of 30 (which is why Bill James dubbed high walking percentage as an "old player's skill"). We'd love to see Soto demonstrate that this isn't necessarily so, but there's a downside: a number of older players who've done this do so to compensate for other skills that are in serious decline, and becoming too passive at the plate can exacerbate those tendencies and possibly hasten their exit. (Witness, for example, the career of Jimmy Sheckard...or what happened to Roy Cullenbine.)

Soto is clearly a greater talent that those two, of course; and he can always get more aggressive, since his next team, when paying for someone with a superstar reputation, is going to want to see higher BA and higher RBI totals that came out of Soto's 2022 season (still an excellent year, as measured by OPS+ and other "more advanced metrics"). So far in spring training this year, Soto is being more aggressive, and he's blistering the ball. We're all for that, as it will be better for the sub-species if he moves out of it for awhile, so that he might return to it for a number of years after he's 30. We still need superstars just as much as we need "uber walkmen"...

Wednesday, March 15, 2023

THE TOP 600 HALF-SEASONS/14: TED WILLIAMS (THE BIG THREE/#2)

Life has been momentously wet over the past week, which has prevented us from putting the voluble Teddy Ballgame in your face until now. Now that things are (at least temporarily...) dried off, it's time to see his 22 half-seasons that made the Top 300 (in either the first half or second half). You'll note that he occupies the #1 slot on one of these lists, and the #300 slot on the other:


Thirteen of these 22 half-seasons occurred by the end of the 1940s, with the bulk of his Top 100 entries coming in that time frame (ten out of fourteen). Note also that Williams was not really a sluggy slugger for most of his career: of these twenty-two top half-seasons, only seven featured 20+ HRs. He was over 15 HRs in a half-season thirteen more times, of course, but 30-35 HRs per season is not really a dominant total for most of the years in his career. This was still a hitter driven by getting as many different kind of hits as possible throughout most of his career.

And there are the three Top 10 half-seasons: no one managed to have them over such a protracted period in a career. As amazing as his second half in 1941 is, it's actually eclipsed by what "old man" Williams (age 38) did sixteen years later. More mind-blowing is how he did it: still suffering from the effects of pneumonia as the season wound down, Williams revved up in the second half of September to hit .632 (12-for-19), including five HRs (two as a pinch-hitter). In the midst of this, he actually drew more walks than hits...and considering how he hot he was (fueled by the remnants of a fever?), opposing pitchers probably should've done to him what they did fifty-odd years later to Barry Bonds--take one look at him and walk him intentionally.

That sizzling but surreal September surge pushed Williams' second-half BA up to a remarkable .454, the second highest half-season batting average in baseball history. (Do you remember who #1 is?)

Time may eventually chip away at a couple of these entries (the #300 in the first half of 1940, and the #293 in the second half of 1960, Williams' final year) but nothing will erode the memory of the game's most cantankerous--and preternaturally gifted--hitters.

Now let's look at Williams' "wraparound seasons" (second half of Year A/first half of immediately adjacent Year B):


Unlike Ty Cobb, whose wraparound seasons produced some prodigiously high batting average, Williams had a more marked tendency to follow a big BA second half with a significantly lower BA in the adjacent first half. But we do see a peak HR total emerge from the 1949-50 wraparound season, where he slugged 48 HRs in 146 games. 

Note also that there are two half seasons where Williams has more walks than hits. It's extremely rare for players to do this over the course of a full season: only 93 players with at least 300 PAs in a standard season have managed to do so (Barry Bonds, of course, did that six times). Williams only did it once in an orthodox season, in 1954 (136 walks, 133 hits). In the first half of 1947, pitchers clearly didn't want to give him anything to hit, walking him 92 times in 317 PAs: he had only 69 hits.

What's notable about the "walks > hits" scenario is how rarely player with high BAs are found on the list. Williams hit .345 in the season where he had more walks than hits: the average player who registers such a phenomenon has hit only .241 when doing so. (Sixty-three of the ninety-three "walk > hit" seasons occurred when the hitter in question hit .250 or less...)

We'll now move on to the man with the most Top 300 half-seasons ever, which is another, admittedly more arcane baseball record that he owns. We will bring him to you just as soon as we possibly can...stay tuned.

Sunday, March 5, 2023

THE TOP 600 HALF-SEASONS/13: TY COBB (THE BIG THREE/#3)

We are now in the realm of the true baseball Gods--the three hitters who remain at the pinnacle of accomplishment across the 160-year history of the professional game. Year in, decade out; generation in, millennium out--they are there, and are likely to remain there until there is no more baseball.

By the measure of Top 300 half-seasons (either first half or second half), Ty Cobb ranks #3. (We'll cover the other two separately in subsequent posts). 

His total of 19 just edges out Lou Gehrig and Barry Bonds, but it's probably not that close. The variably flawed measures that the cognoscenti continue to spar about (Wins Above Replacement and Win Shares) suggest that Cobb's career is of greater value than either Gehrig (who lost several years to a fatal illness) and Bonds (who was something of a late bloomer, not reaching truly elite performance levels until the age of 26). While those methods are flawed, they do come up with an accurate assessment in this case.

Our Top 300 half-season measure is an alternate method for assessing peak performance, and Ty Cobb clearly had his peaks. Let's take a look at all 19 of them:


That's a lot of peak performance, wouldn't you say? Even in our age that continues to belittle batting average, you can't help but be impressed by the fact that Cobb had seven .400+ half-seasons, beginning at the age of 21 in 1909--a time frame when the Deadball Era was thriving (is there some kind of contradiction there? "Deadballs" thriving?? We leave that to you...)

Of course, Cobb did not hit homers--that was the thing in the Deadball Era that was truly dead. But the man could hit doubles and triples with great regularity. (Remember to multiply the totals for doubles and triples you see above by two to get a sense of what those numbers would look like if prorated for a full season: there are ten instances where Cobb's doubles total projects to over 40 for a full season. Note that Cobb would hit 10+ triples in all nineteen prorated seasons that we can extrapolate from his half-season peaks.)

His greatest half-season is clearly his first-half run in 1911, a year when the ball was given some extra oomph. Halfway through that year, Cobb projected to hit 50 doubles and 32 triples--an unfathomable combination even during those times, when triples were the primary power stat. As it worked out, he wound up with 47 doubles and 24 triples for the 1911 season--a feat that no one has duplicated, before or since. (Pittsburgh Pirates outfielder Adam Comorosky came close in 1930, with 47 doubles and 23 triples, but 1930 was also the hittingest year in baseball history.)

1925 also stands out: Cobb was 37, and he decided to change his batting style to show what he could do in the new landscape of the game as defined by Babe Ruth's slugging exploits. He didn't quite have the juice to hit homers with the regularity of a true slugger, but he put on a spectacular show for the first half of the 1925 season, hitting .410, slugging close to .700 (the highest half-season SLG in his career), and registered a 1.194 OPS. 

We can have some more fun with Cobb's half-seasons, using them to familiarize you further with our concept of "wraparound seasons," or the "back-to-front" season-equivalent totals that can be fashioned by adding up the second half of Year X with the first half of Year X+1. When we do that for Cobb, we get six rather impressive wraparound seasons to contemplate:


Note that four of these "wraparound seasons" are composed of eight consecutive "high achievement" half-season. The young Cobb was probably the greatest terror ever seen on a baseball diamond at such an age (he's 21 through 25 during this time). That fact is not exactly unknown, but looking at in this way certainly amplifies it further!

Note that four of Cobb's wraparound seasons produce a .400+ BA, and two seasons in which he hits more than 25 triples. How many players have done that in a front-to-back season? Only five. (One of them, Cobb's teammate Sam Crawford, did it twice.)

Cobb also has ten half-seasons in the Top 100 for either first half or second half. 

It's hard to imagine anyone being more astonishingly impressive than what's displayed here, but we'll return soon with the half-season data for the two guys who actually outpace Cobb. Stay tuned...

Saturday, March 4, 2023

SHIFT "LOOPHOLE" PLAYS RIGHT INTO OUR "CRACKPOT" SCHEMES...

As those of you who read this blog regularly know, we're not fans of the Boston Red Sox. The reasons for this (and for our "anti-fandom" for certain other franchises) are well documented in posts here over the years, but...

So--we reversed the Sox logo to remind you that
we're still in the "anti-fan" category...
...But today we kiss the feet of anyone currently associated with the Red Sox, for they've opened a can of worms with respect to the rules changes underway in baseball for 2023. And by doing so as baseball insiders take a more activist role in shaping the game (as we've been advocating here virtually since the inception of this blog in 2010), they've opened the door for a re-examination of one of our pet ideas that is now just a step away from being 100% relevant to innovations still needed for the game.

So what did the Red Sox do, anyway? They got around the infielder shift ban that promised to eliminate the defense's ability to turn hits into outs (as has been practiced in increasing numbers over the past half-decade). How did they do that? By simply moving an outfielder into the same location that was formerly occupied by the second baseman for purposes of picking off erstwhile hits from left-handed batters.

For, you see, there's nothing in the rules about where you must position your outfielders!

Of course, this constitutes a bigger gamble by teams, because they are leaving a much greater amount of outfield territory open by doing so. The now-banned shift formation kept three outfielders in their standard positions, opening up only the left side of the infield, which made defenses vulnerable to extra singles. This "loophole" implementation that moves an outfielder into short right leaves teams vulnerable to doubles (and possibly some triples) because of the extra ground in the outfield that will need to be covered should a hitter launch one into left field.

SO how does this play into the "crackpot" schemes that you may (dimly) remember being proposed here previously? Our guess is that the players will resist a rule that forces outfielders to be positioned as strictly as possible (though perhaps they could find something that they want in a labor-oriented negotiation in order to permit it). So the "loophole" will likely remain in place--and there's a way to take that "loophole" further in terms of strategy and entertainment value.

That's right, kiddies--we are again talking about our infamous 190-foot rule, discussed here just enough to alienate a few of our former colleagues (who, as a result, can no longer be bothered to stay in touch with us anymore after many decades of friendship). 

For those who've forgotten all about it, the diagram at right is the place to start. We propose to change the shape of extra-base hits and bring back a significantly higher number of triples per game by instituting a rule that has a carefully limited impact on how the game is played. 

The line on the field is where one of the team's outfielders must stand in front of during a single designated inning (so as to not distort the possible outcome of the game, we recommend nothing later than the sixth inning) to forcibly create extra distance between the remaining outfielders. That extra distance will create a significantly greater likelihood of triples during each of the two half-innings it structures how the outfield is to be configured, and it will apply for all hitters in those innings, not just the ones that were targeted by the now-banned "shift."

If you think about it for a minute, our 190-foot rule is de facto the same thing (or at least is highly similar) to what the Red Sox employed the other day.

So why not take this idea further, creating entire innings where the defense is stretched into a configuration that puts them at greater risk due to the increased possibility of extra base hits? A rule like this would incentivize hitters to look for the (larger) gaps in the outfield and try to take advantage of the defense (for one half-inning each, home team and visiting team) having--so to speak--one hand tied behind its back.

How many more triples will occur with two half-innings devoted to a defensive scheme of this type? Our prediction is that the number of triples will be tripled. Fans (or even anti-fans...) will see their team hit a triple ever other game, as opposed to once every six games as things currently stand. 

Now, "Saint Theo" (Theo Epstein, former GM wizard who's now the game's "rules change guru") is on record concerning the fans' desire to see more doubles and triples. We'd like Theo to take off his PR blazer for a moment and own up to the fact that triples are far more exciting than doubles and are about ten times as scarce--so if he really wants to do something significant, he should cast about for a way to dramatically increase the number of triples per game.

In support of that, we have the (admittedly not-scientific) results from Bill James in the form of a Twitter poll he ran a few years ago, which is reproduced at left. Sure, it's only 2300 votes, but those who follow James on Twitter are devoted fans with a deep sense of the current strengths and weaknesses of the game. Those percentages aren't close, folks--as Theo notes, fans want to see more on-field action. And there is nothing more action-packed than a triple--the hit that is the game's perfect combination of speed and power. 

Now even assuming that some folks voted for triples simply because they are so scarce, it still behooves us to find a way to accede to that desire and implement some way of making it happen. Tripling the number of triples is not going to make them so common that folks will say "ho-hum"--and if it's done in the context of an inning where a defensive rule has been (temporarily) imposed to increase those chances, it's going to create anticipation and excitement in the game beyond just the fact that there are more triples.

One question that may remain in your mind is how to actually implement the rule. What governs its use? We see two choices: 1) a random assignment to each team prior to the game, where each is assigned a half-inning on defense (innings three through six) where their center fielder must play in front of the 190-foot line; 2) managers are allowed to choose their half-inning (again, innings three through six) where they force the opposition to align their outfield according to the 190-foot rule. In that way managers can look at who they have coming up to bat and decide when they think they have the best chance to exploit the advantage that the rule will afford them.

But, but--you are objecting. You can't impose such a rule on the defense--it's not fair! We want laissez-faire capitalism to dictate a free, unfettered, ruggedly individualistic brand of baseball where we all "live free or die." (OK, that's a bit over the top, even for us...)

But, semi-conscientious (or is that semi-conscious...) objectors: baseball has already imposed a limitation on defense with their two infielders to a pair of pants--er, to each side of the diamond--rule. The door is now open for other, more creative--and most importantly, strictly limited in scope--additions to such limits in order to give baseball more variety, more unpredictability...

...And more excitement. We remain firmly convinced that this will be the most exciting and entertaining rule change in the history of the game. It will also change the shape of extra-base hits in an astonishing manner. The record for most triples in a season--36, by Owen "Chief" Wilson
back in 1912--will suddenly be in danger. The ghost of the Chief will probably visit us with vengeance on his mind, but we'll calmly inform his shrieking ectoplasm that records--even the record for triples, for Crissakes--are meant to be broken. 

Let's implement this rule and let the fun begin.

Friday, March 3, 2023

THE TOP 600 HALF-SEASONS/12: A FEW NUMBERS GET SKIPPED...

 ...as in 13, 14, 15, 16, and 17. 

That's the "gaposis" in the Top 600 pantheon as we move into the most rarefied, sacrosanct--and controversial--region of the half-season peak performances. 

And we have not one, but two hitters who cracked the Top 300 in either the first half or the second half a staggering total of 18 times.

One is arguably the most venerated of all baseball players (at least this side of Don Mattingly); the other is the most vilified (the flip side of Hal Chase).

We think you'll recognize the names as they each flash by 18 times...


Actually, Lou Gehrig and Barry Bonds make for a fascinating juxtaposition. Larrupin' Lou has his greatest half-season in his very first appearance on the list, with more than 100 RBI, 68 (!) extra-base hits, a batting average of .398 and an OPS of 1.314. It's the fifth best first-half offensive performance in baseball history.

Bad Boy Barry takes a little while longer to get going, breaking through in the "wraparound year" of 1992-93 (second half/first half) where he hits .334 with 43 HR and 125 RBI. The inkling that something extraordinary is coming, however, doesn't really appear until 2000, when his HR totals and SLG take a marked turn upward, presaging the otherworldly achievements that followed in 2001-04, where seven of his eight half-seasons during that time are in the Top Ten of all-time. 

Of especial note is Barry's .908 SLG while he is in pursuit of Mark McGwire's shockingly short-lived single-season HR record during the second half of 2001; like Gehrig's first half in 1927, it ranks 5th all-time. He's in the top ten seven more times during this time frame. His SLG exceeds .800 in five half-seasons. By 2004, no one wants to pitch to him--and he still manages to hit 45 HR that year and post the identical OPS (a staggering 1.421) in each half! 

There are only three players who outpace these two in terms of the number of Top 300 half-seasons...we think you have a good idea of just who they are, and we'll be seeing them directly. Stay tuned...