Friday, December 29, 2023

WORLD SERIES TEAMS WITH SUB-.500 ROAD RECORDS...

THIS is most likely our last post for 2023, with the early part of '24 certain to bring us the chess/checkers machinations of present-day GMs and the ongoing loopiness of the Hall of Fame voting process.

And for a swan song we have something relevant from the '23 season itself--the seventh occurrence of a phenomenon that, in this instance at least, is overlain with irony (fear not, we'll explain that reference eventually)...

Just what are we talking about--seventh son of a seventh son, or something like that? No, it's not some antediluvian mumbo-jumbo: it's simply the seventh time that a team winning the World Series did so despite having a losing record in road games during the regular season.

A total of twenty-three teams have won league pennants while playing sub-.500 baseball on the road, as the chart at right will show you. Only 21 of those are relevant to the World Series, however, since the 1902 A's and the 1914 Indianapolis Hoosiers (Federal League) had no World Series in which to participate.

So that means that one of every three teams to win a pennant with a sub-.500 record in road games has gone on to win the World Series.

AND the most recent team to do so: the 2023 Texas Rangers--who, in the height of irony, achieved their post-season feat by winning all of their post-season road games.

As you can see, most of these teams were just barely "in the red" with respect to their road record--14 of the 21 teams who played in the WS had a road WPCT of .481-.494. The two WS champs who were truly sub-par road teams are shown right up at the top--the 1987 Minnesota Twins (29-52) and the 2006 St. Louis Cardinals (34-47). 

We've never had teams face off in the World Series who both had sub-.500 road WPCTs, but we came close this past year: the Arizona Diamondbacks had a 41-40 record in road games. That combined road record of 81-81 isn't the lowest of all time for World Series opponents, however: such would be found in 1987, thanks to the woeful road record of Twins. Combining their 29-52 with the 1987 Cardinals' 46-35 mark, we get a combined road won-loss record of 75-87 for that World Series--which was the first World Series where the teams won all of their home games.

One last graphic on this--one of our TimeGrid™ charts (at left) showing the evolution of this phenomenon. As you might expect, most of these occurrences have happened since divisional play began, with an added acceleration during the Wild Card Era.

The greatest preponderance for this (thus far, at least) occurred during the 2000s, when it happened six times, including four in a row from 2005-08; it's also the only decade where two sub-.500 road record teams won the Series.

Tuesday, December 12, 2023

OTHERNESS & THE OMINOUS IN OHTANI OMNIVOROUSNESS...

THANK God (or whatever "otherly" being you choose to employ...) that the Great Ohtani Sweepstakes farce is over...we call it "farce" because it seems abundantly clear that all of the other teams involved in the process were always on the outside looking in at a done deal with the Dodgers that, in truth, was mooted for many months. 


As a left-coast denizen, BBB is cheered by the notion that the East Coast media will continue to have to genuflect in a "pacific direction" for as long as Ohtani is the "Great Other" in all the dimensions that he's come to embody for baseball and for the roiling rodomontade that is American culture in the 2020s, the most repercussive decade in America since the 1960s and the 1850s. 

We are not particularly sanguine about the Dodger deal and its overall outcome, however. It's clear that the LA brain trust is looking to create the Greatest Team Money Can Buy (GTMCB), an endeavor as unwieldy as its acronym is unpronounceable. Ohtani's pent-up desire for "world domination" (aka a World Series win) has created a bowling alley worth of lanes for the Dodgers to "de-tax and spend" in pursuit of a lineup that should not only win 120 games but also manage not to slip on that bar of soap in the "October shower" that has mostly drowned their hopes since 2017.

Brilliant (and lucky) trading and painstaking farm system development used to be the way that teams became competitive over a long period; that model still is viable, but the Dodgers are attempting to turn the clock back to the late 90s and be a left-coast version of the "Evil Empire." Their actions may rouse the sleeping dotards in the Bronx to respond in kind, as they've already begun to do with their acquisition of Juan Soto.

The impossibly chipper and sadly doomed Sarah Langs gave us a great stat that reflects the danger involved in stockpiling seeming insurmountable concentrations of talent, however. She mentions that fact that the 2024 Dodgers will have players who finished 1-2-3 in MVP voting from the previous year (Ohtani #1 in AL, Mookie Betts and Freddie Freeman #2 and #3 in the NL). And, indefatigable researcher that she is, she also notes that four other teams had such a situation going for them previously. 

Those teams: 2004 Yankees, 1967 Orioles, 1960 White Sox, 1942 Dodgers.

What Langs fails to note, however, is that while all of these teams were in the World Series during the previous year (only the 1966 O's actually won the World Series), none of these teams made it to the World Series in the years shown above.

The 2024 Dodgers would be the first of such teams to do so--assuming that they can. 

But most of us know, however, what happens when you "assume."

What we have here is a variant of the "unstoppable force" (the Dodger brain trust's pursuit of glory via creative financing and hubris) and "immovable object" (the odd wrinkles in the fabric of the game as played on the field) that will collide head-on next year. There is an ominous undercurrent at work here, a fault line that is waiting to emerge--will it manifest itself and foil the aspirations of the would-be empire builders? Or will the game's variant of the teetering concept of "no one is above the law" fall in the dominoes threatening the degraded form of democracy that still hangs by a thread here in the "land of the free"...? And who of us will be "happy" with whichever outcome prevails?

Stay tuned...

Wednesday, November 29, 2023

2024 HALL OF FAME BALLOT: TEN (MINUS TWO)

IT was a very hectic non-baseball month here once the "final fizzle" came and went like a leaky balloon: we've spent much time on our non-baseball book and the now-ongoing French noir festival (capped by the anguish of Bernard Blier as he stares into a slowly-evolving abyss in THE SEVENTH JUROR, which plays on December 4 as the last salvo in this year's lucky thirteen shots in the dark: should you be interesting in learning more, go here).

We did notice, however, that there are rumblings underway about the upcoming Hall of Fame election: ballots are out to all of those "eligible voters" (may several of them rest in peace...) and the results, such as they will prove to be, will be announced on January 23rd. Two high-profile candidates (Adrian Beltre and Joe Mauer) will make their first appearance on the ballot: we'll discuss their respective chances for induction shortly.

At the social media swamp formerly known as Twitter, the HOF Tracker crew posted a ballot sure to provoke widespread derision, as it contains only two selections from the (mercifully anonymous) voter--who is nothing if not "up to date," since he/she has voted only for the two "hot-shot" new candidates. 

Since we know that folks these days want their information compressed (folded, spindled, etc.), we seized upon this opportunity to use the image to convey our picks--if the BBWAA was reckless enough to grant us a vote, that is.  

Note that we are indeed voting for Beltre and Mauer, who represent high-quality players at positions which remain under-represented in Cooperstown. 

We are also not voting again this year for either Carlos Beltran and Andruw Jones. The former is, in our estimation, a worthy candidate, but we're voting tactically here, preferring to send votes to Bobby Abreu, whose case is (in our minds at least) at least as deserving and who is not drawing the type of support he warrants. We can only hope for a stall in the "quant quackery" driving the voting surge for Jones, who is to the "silly saberist" cabal what Jack Morris was to the dying curmudgeons of the old BBWAA. Morris was subsequently shoved into the Hall via the side door, and that should also be the case for Jones as well. 

Meanwhile, three far more deserving candidates--Alex RodriguezGary Sheffield and Manny Ramirez--will continue to struggle on the thorny vine of non-objective voter behavior, with Sheffield needing a serious boost in his final year on the ballot to make it in via the front door. 

We continue to cast votes for Todd Helton and Billy Wagner, hoping that both of them will get over the line in January, after which we suspect they'll accompany Beltre to the dais during 2024's induction ceremony. We expect Mauer to come up a bit short in his first time on the ballot, but we figure he'll likely make it in either 2025 or 2026. 

Folks might raise eyebrows over a pick for Andy Pettitte, but this is a solid choice when we consider that this is someone who pitched much of his career in an era of heightened offense. 

And finally, our tenth pick is another first-timer on the ballot, Chase Utley, who needs votes to stay in contention over the ten-year ballot period. Utley stands in for fellows like Lou Whitaker, Bobby Grich, Larry Doyle and Jeff Kent, all of whom should be in the Hall of Fame but aren't. We figure he'll get 20-25% of the vote this time, and then the question will be if some interest group decides to turn their neon crowdsourcing shenanigans loose for him--in this case, such tactics would be fully warranted.

SO there you have it. We have fifty-six days to wait for the official results, but we'll do what we can in that time frame to distract you...stay tuned.

Thursday, November 2, 2023

SNAKES RATTLED, FALL INTO 5-GAME WORLD SERIES GHETTO

AN unorthodox World Series featuring two Wild Card teams began with great promise in Texas last week, with the Rangers and the Diamondbacks splitting two games with intriguingly different tonalities and setting up what appeared to be a compelling "punch-counterpunch" rhythm. 

But then the teams moved to Arizona, and that scenario swiftly fell apart, with the Diamondbacks' pesky offense suddenly sputtering in Game Three, followed by a catastrophic "bullpen game" whose 11-7 score was lucky only for the Rangers, and then...

AND then a Game Five where the Snakes were clearly rattled by their inability to score anyone despite five consecutive innings in which they had runners in scoring position. Their ace starter Zac Gallen was pitching a no-hitter, but Arizona's inability to take control of the game cast a pall over the proceedings that swiftly took on inevitable dimensions. The Rangers, working on a remarkable road winning streak, finally broke through against Gallen in the seventh, and the hissing sound that had become progressively more audible was not from the D-backs (no "snaking" back into the game forthcoming) but instead the sound of air leaking out of any and all receptacles--tires, balloons, and several orifices (not) to be named later.

Snakes' closer Paul Sewald, acquired in mid-season to reinvent the top end of the Arizona bullpen, delivered the coup de grace when he allowed four runs in the ninth, dooming the D-backs to a place in the lower depths of World Series history: the ghetto of the five-game series. 

IT is now an architectural archipelago with twenty-seven separate buildings, housing 135 games in all--108 of which were won by the World Champions, and only 27 by the D-back's luckless brethren--exactly one win apiece for 27 teams who simply fell on their swords. 

Very few five-game series are memorable, unless they are upsets: the ones that qualify include those played in 1969 (Mets over Orioles), 1988 (Dodgers over A's), and arguably 1942 (up and coming Cardinal dynasty shocks the Yankee dynasty). 

The sense of deflation that occurs in a five-game series can be seen in the results when we quantify wins/losses on a game-by-game basis. Simply put, an event horizon just clicks into place in Game Four which pushes things inexorably in the direction of the winning team. The aggregate record in Games Four & Five of a five-game series is as starkly dominating as you can get without an outright sweep: 54 wins for the eventual champ, vs. just three for the eventual chump.

THERE are some mildly interesting sub-patterns that emerge in the constricted world of the five-game series, which we'll briefly examine. The Snakes' pattern (splitting on the road, swept at home) has happened only three times previously, all of them involving the Yankees as the winning team (1941, downing the Dodgers; 1949, rinsing and repeating with Brooklyn; and 1961, ripping the Reds a new one in their home park). 

Another dramatic pattern--drop the first game and win four straight--has also happened only four times: in 1915 (Red Sox over Phillies), 1942 (Cards over the Yankees), 1969 (Mets shock the O's and the world), and 1983 (O's take to the Phillies). 

Rarer still is the "win first three, drop Game Four, win Game Five" scenario--shared only by the 1910 Philadelphia A's, the 1937 Yankees, and the 1970 Orioles. 

Nine teams have won the first two games, lost the third, and won the last two--we'll let you pick those out for yourself from the table above. 

BUT these sub-patterns don't really deflect us from the fact that the five-game World Series is just a collection point for an escalating (and simultaneously deflating) sense of lost opportunity. The teams that win and their fan base are, of course, extremely happy, but years later they're likely to have a much fuzzier sense of how and why their teams won. That's because the win came a bit too easily: the sense of competition has been stunted, leaving a mental wasteland that is inextricably intertwined with the desiccated landscape of the "five-game ghetto."

It's been five years since the most recent five-game series; the longest span of time between such series is thirteen years (1916 to 1929). That sounds about right: let's cross fingers that we don't see another one until at least 2036...

Friday, October 27, 2023

DISTRIBUTION OF POST-SEASON RESULTS: ISOLATING THE "CRAPSHOOT"...

SO you've heard the complaints this year about the playoff system going off the rails because many of the teams with more wins than their post-season competitors wound up losing (raise your hands as we call your names: Braves, Orioles, Dodgers, Rays). 

And you've heard the countervailing comments that have been in force for many years before the further "wilding" of the Wild Card team had produced a general feeling of chaos matching what many feel about the world at large. Namely: "the playoffs are a crapshoot." (Joe Sheehan, crusty Baseball Prospectus renegade, is especially vehement--and numbingly repetitive--with respect to this mantra.)

WHAT's missing in all of this, of course, is some kind of empirical data with which to actually assess the situation. (A condition that is shocking but not surprising in the still-blinkered and more-than-occasionally embedded world of baseball media.)

So--as is usually the case--here we are, in Atlas mode, carrying the worldly weight of such tasks squarely on our shoulders...and providing some answers never seen before. Let's get to it...

FIRST, note the summary total (for all post-season games of all types, since the invention of the World Series in 1903). It shows that teams with better records than their opponents (column marked "B") only hold a slightly better than 50% success rate. That percentage was higher in the "pennant era" (1903-68) and the first era of division play, which we call "the championship series era" (1969-93), but has dropped since.

Note that since 2000 this percentage is less than 50% (all such occurrences on this distribution table are shaded in blue).

WE then go on to break down the World Series by length of games. Note that as the number of games in the World Series increases, the likelihood of the team with the better record being the winner declines (from 65.5% in sweeps to just 43.3% in seven-gamers). But note also that this trend is reversing itself  for seven-game series since 1995, which kicked off what we call "the wild card era."

SWEEPS are where the better teams do best at holding their own (with one exception, that we'll look at it later). The World Series sweeps (4/0), now somewhat mixed in with ALCS/NLCS  data, and the old CS format and Division series sweeps (3/0) yield an aggregate success rate for 71% for teams with the better won-loss record. 

When we get into the Division Series' 3/1 and 3/2 subgroups, we see a stark decline: the 3/1 series are only 50/50 for the better team, and the 3/2 series, fueled dramatically by the changed dynamics in the "wild card" era, have been on an excoriating run against the better teams, who've won barely one-fourth of those series since 1995. This is the hidden story of how "the playoffs [became] a crapshoot."

And similarly, in the best-of-3 series (the variants of the more recent "wild card era" approach), the "sweeps" (the 2/0 series results) have thus far pushed against the team with the better record. In the old "one and done" variant of this approach, you can see that the results when broken out in the three categories--better (B), the same (E), and worse (W)--are virtually random.

All of these shorter series are currently running against better teams, who've won only forty percent of the "one and done" and "best of three" series. 

SO this is the structural anatomy of the post-season, and how it's changed as the post-season itself has changed. How this might look in twenty years absent any better system (and readers here know by now that we have several of those, including a new one that we'll discuss here after the World Series) is really anyone's guess, but there's no reason not to think that it will remain reasonably similar to what we see here.

It can be argued that we should break these categories (B/W) into smaller units that show the range of difference; while the sample would be smaller, it might provide some additional nuance. It can also be argued that we should use Pythagorean Winning Percentage for this breakout--and if that data were readily available, we'd do so...but none of the reference sites has seen fit to compile this in an easily accessible framework, and until they do so, we are constrained by time issues from doing so. (If someone provides it to us, however...)

Thursday, October 26, 2023

21ST CENTURY POST-SEASON STANDINGS...

YOU may not have seen the data posted below...we'd not thought to retrieve it from the trusty folks at Forman et soeur, but the light bulb finally flickered a bit and managed to stay on. 

It's a summary display form that's probably new to most of you, but don't let it throw you off.


Note that this covers the 21st century only (just in case you're not ready the titles of the posts!) all the way up to this year's Championship series.

Interestingly, the Phillies are still the team with the best overall WPCT amongst teams with a sizable number of post-season games. They're slightly ahead of the Giants and Red Sox, the two franchises with the most World Series wins since 2000. The media has noted the long post-season losing streak of the Minnesota Twins, but we're not aware of anyone posting their overall record, which might actually be more astonishing....

The Yankees have still played in the most post-season games (161), but haven't had much to show for it since 2009. Behind them are the Cardinals (142), Astros (130), and Dodgers (126). 

The Royals remain the great outlier, destroying literally everything in their path whenever they manage to make the post-season, but mostly operating as baseball's resident iceberg. Still, they're not the franchise with the fewest post-season games since 2000: that would be the Pirates (8), followed by the Reds (11), Orioles (17), Rockies (20), Mariners (24),  Padres (25), and White Sox (26). 

We added a few basic rate stats to add a little more spice to things. Note that the Rays are the homer-ingest team by the HR/G measure, but also note that it's not done them much good (no World Series win, and a very middling .438 post-season WPCT). 

HR/G for post-season games since 2000 (1.12) remind us that "launch angle" was with us even before it was a "thing"... but note that the Giants did manage to buck the trend, winning three titles with significantly lower-than-average HR/G rates. (Much of the reason for that would be more evident if we were to run these standings again, but with pitching data--something we may just do after the World Series.)

Both of this year's participants in the World Series have burnished their post-season records sufficiently with their respective run-ups to the Fall Classic to currently be .500+ for their relatively limited number of playoff games (54 for the Rangers, 48 for the Diamondbacks). Odds are high that they'll both still be over .500 after the series, unless someone gets hot and sweeps the other one. 

But let's kibosh that thought and root for a seven-game series, shall we? While the game still has many problems to overcome, it's still far worse when there are no games at all. Let's savor what remains...

Saturday, October 21, 2023

MONTHLY PITCHING DATA SPECIAL EDITION: STRENGTH/WEAKNESS INDICATORS FOR POST-SEASON TEAMS

WE'll publish the full season's worth of the monthly team pitching performance data (for both starters and relievers) after the World Series. A smidge of it will appear in this special report, where we look at the best team months for starters and the worst team months for relievers.

Some of this is prompted by the dogged distortions still being compiled by dear old John Clay Davenport, the original mastermind of the Baseball Prospectus "statitude adjustment cadre" (as we used to call it back in the day of BBBA). We recall being temporarily impressed with Davenport's efforts, but a closer look confirmed that it was just another form of reverse engineering that had no added value to our understanding--a feature that, for the most part, has continued in the field of "neo-sabermetrics" as practiced from ca. 1995-2005, then codified with new ideological fervor once these folks had penetrated into the mainstream, and finally overbaked thanks to the monomaniacal brigade marching to the chowdery chiliasms of the Tango Love Pie™.

In this instance, Davenport was quoted by Joe the P. for his eye-rolling "third order standings," which, in this instance, purported to tell us that Clay's centripetal engineering of the Pythagorean Winning Percentage (PWP) contained heretofore hidden insight that the Texas Rangers were the second best team in the AL and really should have won 97 games.

As is almost always the case with Clay, this sounds very impressive until you realize that the original PWP projected the Rangers to win 96 games. But this didn't stop Joe from giving it a ham-fisted place of prominence in his attempt to explain why the Rangers were doing so well in the playoffs, while teams with more actual wins (and fewer "projected" wins) were not.

IT was all "expiration date" glibberish that happens in the baseball media's silly season, but it made us realize that our monthly data--customarily derided by the lock-jawed lock-steppers in the (post)-neosabe world, could give us some actual insight into potential vulnerabilities that might crop up in the short-series mode that defines (and often makes strange) the post-season.

AND so we present the best starting pitching months based on the stat breakouts collated from Forman et soeur's team pitching splits data for 2023. First up is the AL data, which shows us that six playoff teams in the league--O's, Astros, Twins, Rays, Rangers and Jays--all had a least one month where their starters were collectively ten percent better than the league OPS (as measured by OPS+, which here is annotated by bb-ref as sOPS+; remember that since it's pitchers we're examining here, the higher the OPS+ the worse the pitching performance is). 

Oddly, the best team month occurring in the AL in 2023 is the one turned by the Detroit Tigers' starters in September. That could be a harbinger of things to come in 2024, or not--one of their main contributors, Edwin Rodriguez, is a free agent and is unlikely to stay with the Tigers. 

The O's, Twins and Rangers had three "top SP months," while the Rays had two. The Rangers took out the Rays, the Twins took out the Jays, and then the Rangers took out the O's while the Astros--with only one top SP month on us list--eliminated the Twins. (Remember that the Rays were missing their top three SPs in the playoffs due to injury.)

Overall top SP months produce close to a two-out-of-three WPCT for their teams (.656). The embattled Red Sox, who finished last in AL East, had the bad luck of having the only top SP month where the pitchers had a sub-.500 record.

NOW to the NL. Five playoff teams--Braves, Dodgers, Marlins, Brewers and Phillies--had at least one top SP month; the team with the most (Padres, with four) had spotty hitting and a surreal lack of success with their bullpen and missed the playoffs entirely. The Marlins and the Phillies had the best single months from their starters, but the Fish were missing several of those folk in the post-season and Philadelphia prevailed easily. The Brewers' SPs did not carry them in the post-season, and the Diamondbacks (no top SP months at all) pushed past them in the ultra-short Wild Card series. 

The Dodgers, with only one top SP month all year, were also betrayed by their starters, and the Diamondbacks dispatched them as well. After frying the Fish, the Phillies then scalped the Braves (whose pitching was shakier than what its offense-driven 104-win season suggested) thanks to galvanic performances from their 1-2 punch of Zack Wheeler and Aaron Nola (and a widely ballyhooed bullpen ambush in Game One).

So weak/thin SP for the Braves and Dodgers masked by other compensating performances during the regular season spiraled out of control quickly in the post-season. 

NEXT up: the worst relief months. Let's begin with the AL, where we'll see that the large majority of bad bullpen months are found amongst also-rans (seven of the ten teams shown here, with just half of the playoff teams--Astros, Rays and Rangers--represented. 

And so the teams with the most vulnerable bullpens--Rangers (three bad months) and Astros (two bad months) managed to bypass that problem until they met for the right to be in the World Series. 

Bad bullpen months don't always produce catastrophic won-loss results: all three playoff teams were at or above a .500 WPCT from their bullpen in those months where the performance was rough. Astros, Rays and Rangers relievers went 33-32 in those months--the sign of good offensive teams that can overcome bullpen meltdowns.. (But the also-rans combined for a 60-98 record from relievers in bad bullpen months.

Moving to the NL, things are more random in nature. We see five of the six playoff teams with at least one bad bullpen month (Diamondbacks, Braves, Rodgers, Marlins and Brewers. The Fish, who won a ton of one-run games and who had a PWP for the year under .500, did the high-wire act with two bad months that still managed to produced a 21-8 record from their relievers!

That anomaly helps to account for the fact that bad bullpen months show an aggregate WPCT for relievers at not that much under .500 (.474 to be exact).

Ironically, the Phillies, with no bad bullpen months, have started to struggle against the Diamondbacks in the Championship Series because several of their relievers have coughed up leads since the series moved to Arizona.

So in short series, starting pitching seems to track well with success, but even teams with a rock-solid bullpen can turn victory into defeat at a moment when it can be most costly--in a short series where one squandered game make all the difference. 

(That said, we're not quite ready to write off the Phillies. They will, no matter what, get to return home for at least a Game Six; they are very hard to beat at home. The Diamonbacks did pick up a solid closer in Paul Sewald, however, and their bullpen had its best month in September: so things look as though they could remain very unpredictable as we lurch our way to the Fall Classic. Stay tuned...

Monday, October 9, 2023

KERSHAW'S LESS-THAN-AUGUST OCTOBER COMPANY

The word on everyone's lips after watching the Dodgers-Diamondbacks game Saturday evening: Ouch. 

Prescriptive Hall of Famer Clayton Kershaw came out throwing clay pigeons instead of pills, and seven batters later he found himself being wrapped in gauze in the dugout. He did manage to get one batter out, but the other six Arizona batters crossed the plate: it was a macabre continuation of the intermittent horror movie that has so often taken over when Kershaw--so dominant in the regular season--tiptoes into the playoffs.

We're not here to pile on, despite what some might be expecting. We'll just say that the ways of kryptonite are more mysterious than any of us can fathom. Instead, we provide solace and something akin to comfort by placing Kershaw's unfortunate meltdown in historical context.

You are invited to feast (or shield) your eyes from the chart below, which lists (with thanks, as usual, to Forman et soeur) all 39 post-season starts in which the pitcher recorded either no outs or one out...


You may be surprised to discover that the record of the teams whose pitchers made such quick and unceremonious exits isn't quite as catastrophic as one would expect: 10-29, which is just as respectable as the 1962 New York Mets. (So: horrible, but not unmentionable.)

Pitchers in the 21st century with such ultra-short starts (eleven in all) are shown in red type.

There are some extremely short starts here, and it's possible that some enterprising expert on the post-season has documented why such pitchers as Curly Ogden, Wade Miley, John Thomson and Johnny Cueto were such spectacular first-inning blips. (Injury is, of course, the most likely answer.)

As you might have suspected, there are no other Hall of Fame pitchers on the list aside from Kershaw. Arguments could be made on behalf of Dwight Gooden having possessed Hall of Fame-level talent, but Gooden's early flameout in the 1998 ALDS occurred long past the time when folks talked about him in hushed tones.

The worst first-inning performance that a team was able to overcome and win the game anyway: the Pirates' Vic Aldridge, in Game Seven of the 1925 World Series. 

The worst start from an ethical standpoint: Lefty Williams' infamous tank job in Game Eight of the haunted 1919 World Series.

The only time that there were two such first-inning flameouts in the same World Series happened in 1960, when the Yankees' Art Ditmar and the Pirates' Vinegar Bend Mizell swapped stinkeroos in the early stages of one of the most wild & woolly Fall Classics ever. 

[ODD NOTE: Bill James' Game Score method, shown in the second-from-left column, goes a bit goofy with such short starts. Recall that it starts off with a score of 50 and moves up and down from there: it just doesn't get enough data to move the needle as far as we might think. Let's note, however, that Kershaw's score--14, which should probably be translated to -36 for the purposes of its actual game impact--is the worst out of all the 39 "brief encounters" shown here.]

Let's close with some small amount of solace for Kershaw. His six runs allowed in a third of an inning was not the absolute worst performance of its kind in the post-season.  In 2019, Mike Foltynewicz and Dakota Hudson each allowed seven runs in the same brief but brutal span. In their cases, however, there were errors behind them that contributed to their early demise.

Will we see another of these meltdowns in the current post-season? As we just saw, there were two in 2019, and two last year (Aaron Civale and Mike Clevinger). Remember, the post-season is still just getting underway...stay tuned.

Thursday, October 5, 2023

SWEEPS SWEEP AWAY MEDIA BRAIN CELLS...

THE silly season is upon us again: the dopey, overwrought, amped-up post-season as brought to you by folks who are (heh, heh...) supposed to know better. 

It only took two days for the media to whip itself into "mid-season post-season form," getting all fluttery about the cluster of two-game sweeps in the four best-of-three series that came, saw, and conquered the vanquished before the folks who blather at you for a living could get their wind machines up to eighty percent capacity...

Of course, right in the middle of all this, with blather left over from his ceaseless, tedious, tiresome, tendentious (...) plugging of his new book, was Joe the P., making large out of small (sometimes a good thing, but rarely in his hands...). Ol' Poser Joe was mesmerized by the collapse of the Rays and the Brewers--as if these teams haven't shown some propensity for quick exits in the post-season in their recent appearances. (You forgot to make those windmill noises when you look things up, Joe baby: you were too busy hyperventilating.)

Likewise for the Toronto Blue Jays, who have made a career of late out of underperforming--why the heck wouldn't they extend such a tradition into the post-season? 

Let's make large out of small just like the paid idiots...during the regular season, the Rays had trouble with the Rangers, losing four of six from them. Add to the fact that the Rays were missing their two best starting pitchers and their starting middle infield, and one could figure that they might be vulnerable in such a situation. The irony here, not reported on in the media--all too busy hyperventilating, natch)--is that the Rangers' #3 and #4 starting pitcher pickups in terms of name and reputation--Jordan Montgomery and Nathan Eovaldi--are the ones who throttled the Rays, not Jacob deGrom and Max Scherzer. (And let's be honest--a best of three series is a lousy idea to begin with--teams deserve a bit more latitude than that after churning away for six months.)

Likewise with the Brewers, who lost four of six from the Diamondbacks. The Jays split six games with the Twins--but, just like the Rays, they left their bats elsewhere. 

And the Marlins were fishy from the get-go, with their bizarre success in one-run games and long possum-play in the middle of the season. Even though they'd held their own against the Phillies during the regular season, the world of baseball was hardly surprised when the Fish were washed up on the shores of the Delaware River.

SO what else is behind the rejoinder in our title, anyway? Just how out of touch with the nuances of the post-season are these guys (and gals), anyway? Let us count the ways for you...

First, no one in blowhard media mode bothered to research the history of the post-season to see just how prevalent sweeps actually are. Here, of course, we abhor a vacuum just as much as the next guy (and gal), but we actually do something about it. And so the chart at right tells you what you need to know about three-game sweeps in the pre-World Series portion of the post-season. As you can see, three-game post-season sweeps were fairly common in the early years of divisional play (36%).

THEN there was a caesura (you can call it a "gap," we don't mind...) for a little while when baseball decided to make all of the post-season series into best-of-7 affairs. That lasted until 1995, when the three-division format finally made it into a post-season (thanks so much, Budzilla, for the travesty of 1994...) and another layer of post-season play was created. Sweeps started to decline percentage-wise as a result, and they became scarcer still once the winner-take-all wild card game was introduced in 2012.

So...baseball fans and media folk alike became subliminally conditioned to fewer three-game sweeps, and this is part of why the clustering we just witness has them agog (yes, we've been waiting for a long time to drop that word into play here)...

EXCEPT--we've left out something...something significant that destroys, obliterates, mutilates (even spindles...) that explanation. And what is that shiny, quivering piece of significance?

It's the fact that we've already had twelve best-of-three post-season series during this decade. We had eight of them in the chaos of the 2020 (post-)season: perhaps all of that overkill just collectively wiped away the media's normally elephantine memory banks. For out of those eight best-of-three series, six of them were two-game sweeps.

And it was likewise last year, during the first implementation of this funky new format. There were four best-of-three series played this time last year (i.e., 2022)--and three of those were two-game sweeps.

OK, kiddies, let's add that up, shall we? We've had twelve best-of-three post-series, and nine of them were two-game sweeps--that's 75% of them for those of you playing along at home--and the pundits are (yes...) agog when we have four such two-game sweeps to start things off this year??

So now, let's add things up again, shall we? Now we've had a total of sixteen best-of-three post-game series, of which thirteen have resulted in sweeps. That's 81%.

Why are these chuckleheads so surprised? Is it because they're chuckleheads? 

Or are we just being too kind...we'll let you decide.

Friday, September 29, 2023

QMAX: WEIGHING IN ON WAINO

St. Louis Cardinal mainstay Adam Wainwright survived a calamitous final season, bringing his win total to 200 with a miraculous near-return to form this past September 18th. Indications concerning his stuff--which had been harrowingly absent for yearly a calendar year--were so dire that he almost didn't make his scheduled start.

Fortunately, all's well that ends well for one of the true "good guys" in the game, and a pitcher whose career interruptions have concealed his level of achievement. As we use the Quality Matrix (QMAX) to survey Waino's career in greater detail than has been done elsewhere, let's begin by noting a fact that has also been strangely overlooked with respect to his career.

What's that fact? Wainwright made three successful comebacks from significant injuries, ultimately returning to a level of excellence on each occasion--a feat that is remarkable even in this age of rampant, escalating arm injury (particularly to starting pitchers). He was fortunate to be more of a "pitcher" than a "thrower," even at an early age, which aided him in ways that aren't necessarily available to the more two-dimensional "flamethrower" types.

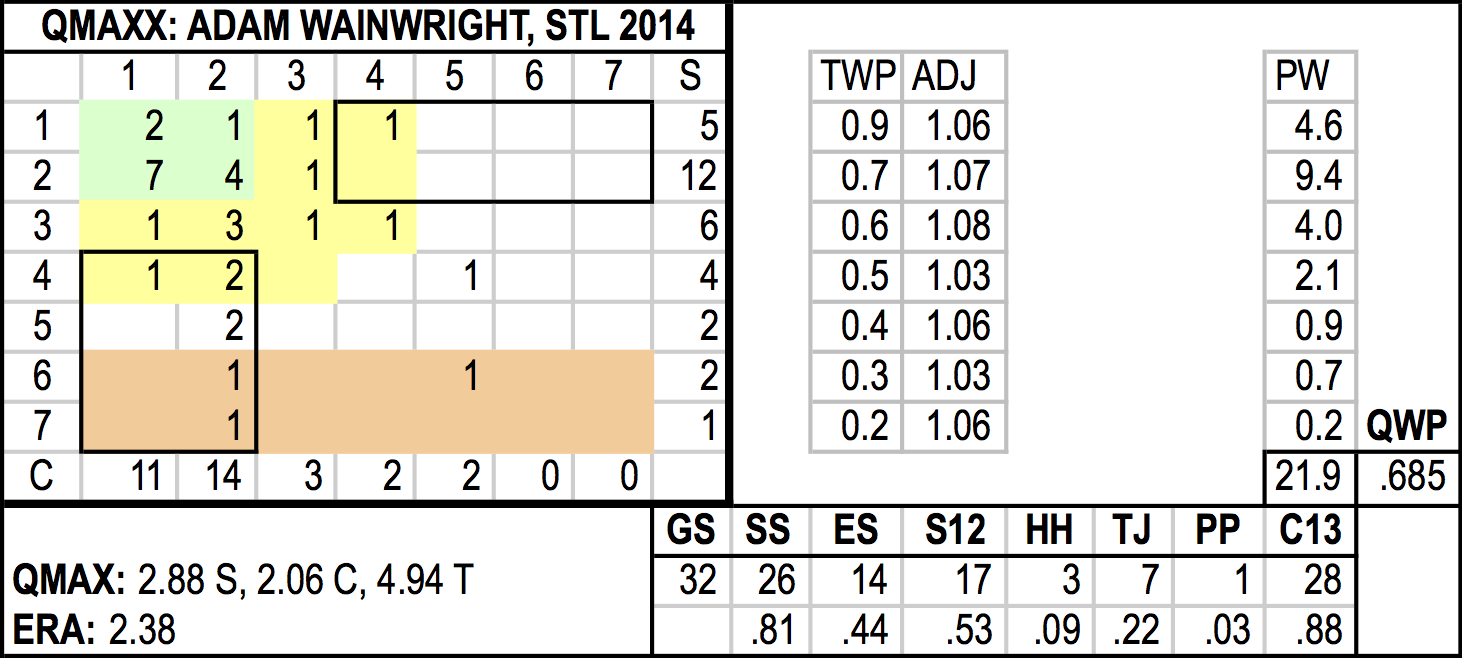
Let's get right into the data for Waino, using information gleaned from Forman et soeur (and then augmented with a newly-revamped and upgraded QMAX):


We are looking only at Waino's starts here, so you'll notice right off that his win total is not 200, it's 198 (the number of wins he achieved as a starter). Over at the right, shaded in yellow, you'll find the special BBB QMAX data, which includes a couple of stats you've probably never seen before (TB/H, or total bases per hit; and TB/IP, or total bases per inning pitched), both of which come into play to add precision to the calculation of the QMAX "S" score, which measures hit prevention.

Before we go further into those added nuances (which will explain some things about pitcher types that rarely if ever get taken into consideration...), let's note the gaps in Waino's career that are somewhat hidden in the above data. 

First, note that there's no line for 2011: that was his first year missed due to injury. It took a year for Waino to regain his form after that, but he led the Cardinals to the World Series in 2013 and had what might be his best overall season the following year.

Then, another injury occurred in 2015--serious enough that many folks feared it would prevent Waino from returning at all. He was a lesser version of himself in 2016 and 2017: a good bit more hittable (with a sharp increase in both TB/H and TB/IP). 2018 began more promisingly, but it wasn't long before he was on the shelf again, which again left his career in doubt. 

But Waino rehabbed well and made it back for 2019, where in the second half of the year he began to round into something resembling his 2009-2014 peak, reeling off a five-game winning streak in September. The delay in the 2020 season due to COVID seemed to have a salutary effect on him as well (except for an uptick in HRs allowed), and he finished that abbreviated year with his lowest ERA (and QMAX "S" score) since 2014.

2021 and most of 2022 were more of the same, as the now-"elderly" Waino was almost as good as new at the age of 40. Prior to another physical setback in September 2022, he had the fifth best ERA+ over a three-year career span from ages 38-40 (124, behind two Hall of Famers--Randy Johnson and John Smoltz--and two other notable late bloomers, Jamie Moyer and Dennis Martinez).

THAT late-season setback in 2022 proved to be catastrophic for Waino--he would never pitch effectively again (save for the miracle game this past September 18th). In 2023--an agonizing season for both him and his team--he hit a wall in late June and lost ten games in a row, jeopardizing what had previously been a superb personal WPCT (sending it spiraling toward .600, a figure we'll return to a bit later). The Cards, committed to their long-time ace, and in a year where it was abundantly clear they were going nowhere, gamely pitched him game after game, in hopes that something--anything--would turn around. 

On August 17th, Waino actually pitched rather well--allowing just four hits over six innings. But the Cards' hitters didn't cooperate, deepening what would prove to be a pronounced second-half slump--and it proved to be his eighth straight loss. Eleven days later, he left the game in the seventh tied 0-0, but the bullpen allowed his baserunner to score for his tenth loss in a row. The two good to excellent performances that Waino willed into existence in September lowered his ERA to 7.40 for the year. (You can see the eerie consistency of his pitching from 9/22 to 9/23 in the first row of data in the master chart with green coloration: it's clear that there was nothing left in the tank.)

AND the contrast in the seasonal matrix charts just above also highlight the night-and-day difference in Waino's performance level. QMAX's "success square" (the green and yellow regions in the upper left of the matrix) is something that Waino hit about two-thirds of the time in his career: in '21, a fine year, he hit it three-quarters of the time. From September '22 on, he hit it only 15% of the time. In '21, he gave up more hits than innings pitched just seven times in 32 starts (about 22%); from September '22 on, he gave up more hits than innings pitched twenty-two times in 27 starts (about 81% of the time). That's about as deep a hole as you can dig and still be pitching in the big leagues.

All of which reminds us how quickly things can change in baseball--how slender the line can be between success and failure. 

The matrix chart for Waino's last 27 starts gives us a sense of what "replacement level" starting pitching looks like while also demonstrating the performance nuances when we place them into the QMAX context. Those twenty-two starts where the "S" score is 5-7 produce a probabilistic winning percentage (what we call the "Quality Win Percentage," or QWP) of .327. Over the course of a 162-game season, that would work out to just about 53 wins. 

It was a sad coda to a brilliant, injury-riddled career: but we can all be heartened by Waino's success in reaching a "magic number" (200 wins) which is presently an endangered species in terms of starting pitcher performance measures. 

Here's one last "contextual QMAX" aggregation for you vis-a-vis Waino's career performance, via a look at the key QMAX regions within the performance matrix. The chart at right shows those regions: the "success square" (delineated earlier) and the "elite square" (the 1,1/1,2/2,1/2,2 "best games"); the two top rows (S1/S2) which contain the top hit prevention games; the converse, in the bottom two rows (S6/S7), which constitute the "hit hard" region; and, most pertinent in the case of Waino, the region we call the "Tommy John" section of the chart, the box encompassing the starts where hits are at least equal and often greater than the number of innings pitchers, the region spanning (4,1 to 7,2) on the matrix, where pitchers manage to win games because the type of hits they give up in such games are more often singles than extra-base hits, thus allowing a higher percentage of stranded baserunners. We've highlighted that data in light blue above, while presenting all of Waino's full seasons (representing 368 games, about 85% of his career starts). As you can see, he consistently lived in the "Tommy John" region, with nearly three times the overall historical average of his starts residing there. (The region also requires excellent control: pitchers who live here do not put extra men on base via the base on balls.) 

This is also why, when you examine basic QMAX S to the more XBH-encompassing QMAX S', you'll see that Waino's S' values are consistently lower (better) in comparison to the basic measure, meaning that all those starts in the "Tommy John" region added value to his overall performance. (It's the nuance in QMAX that is missing from all other evaluation methods.)

It's possible that Waino was the last great exemplar of this type of pitcher: only time will tell if the pendulum within the game will swing back in this direction...

WE'LL revisit Waino's career record when we get into the latter phase of "awards season" at the point when Hall of Fame voting occurs (early January). Keep your focus on the line in the master chart that shows his record from 2007-2015, for that will be one of the key data elements used in evaluating his case for potential enshrinement in Cooperstown.

Thursday, September 14, 2023

BASEBALL'S RACE TO WATCH IS NONE OF THE ONES YOU THINK IT IS...

THE post-season of 2023 is unlikely to have the type of upsets that were so galvanizing in 2022 (at least in Philadelphia). The likely Wild Card teams in the National League are noticeably weaker this year, while the American League will have a strong Wild Card team from the Eastern Division who should have an easier time advancing due to a weak Central Division winner.

Fans in Houston, Dallas, Seattle and Toronto may well sweat things out as the season's final days wind down, but their teams' chances against the Rays and the Orioles look to be slimmer than usual. And rooters for the Phillies, Cubs, Giants, Diamondbacks, Marlins, and Reds will be thrilled if their teams make the post-season, but none of these teams project to get far against the Braves and Dodgers.

And if mediocrity manages to give itself a hot foot, you have the ungainly prospect of a flawed team goose-stepping around in glass slippers. 

SO what to do in light of this looming torpor? Well, of course, there's only one sensible thing available: you need to hunker down and focus on the one truly compelling race going on in baseball at this point.

And what's that? Why, the race for the bottom of the American League, of course...

The A's and the Royals have been locked in a see-saw battle for much of the season, and as we await the Ides of September tomorrow, the two teams are separated by a mere half-game:

OAK 46-100, KCR 46-101

Frankly, the specter of two seriously flawed teams lumbering down the final weeks of the season in what some ways might call "a literal dead heat" is a rare enough occurrence that it should get national coverage along with all the mediocre teams stumbling their way toward the playoffs.

The A's have some intriguing young players (Zack Gelof, Esteury Ruiz, Mason Miller, Tyler Soderstrom) who could form a solid core, but they'll be treading water for a couple more seasons. The Royals continue to be a team that can't draw a walk even if the count on the batter started at 1-0 in every at-bat; their mid-level breakout player Bobby Witt Jr. is another one of these. Whereas the A's have passable pitchers who could form a portion of an acceptable starting rotation behind Miller in Paul Blackburn and J. P. Sears, the Royals' only hope for a bankable starter is lefty Cole Ragans, acquired from the Rangers at the trade deadline. 

Oddly, both of these teams managed seven-game winning streaks during the season: the A's spurt in June caught them up with the Royals, who regained a solid lead over the A's in August with their own streak. Since then, however, the gap has closed, with the A's actually taking the lead again just a few days ago.

What do the remaining dates on the two teams' schedule look like? Glad we asked for you...

ROYALS: Home games vs. HOU (3), CLE (3), NYY (3); Away games vs. HOU (3), DET (4)

A's: Home games vs. SDP (3), SEA (3), DET (4); Away games vs. MIN (3), LAA (3)

The A's would appear to have the slightly easier schedule down the stretch.

WE don't usually have a rooting interest in pennant race matters, as you may recall--there have been exceptions over the years, when certain improbable teams have emerged from obscurity to captivate us in just the right way. Here, however, we're clearly on the side of the A's, for having been one of the early models of "outside the box" thinking in baseball, and for their sustained success in doing so. While we sympathize with Royals players as they endure yet another miserable season, the franchise's stubbornly retrograde approach and their maddeningly flukish success in 2014-15 have always been sore points for us (and, surprisingly, we are not alone in such a perspective, which is a notable rarity when it comes to such matters). 

So we'll just say it once: Go A's.

You should keep an eye on this yourself, just in case the wonky media decides to ignore it all. But, hey, this is a race that could go down to the very final day! (Stay tuned...)

[UPDATE 9/20: Or...not. The A's are trying out more young starting pitchers, and the results have not been good--a five-game losing streak at home (Padres, valiantly trying to sneak into the wild card race, followed by the Mariners, trying to stay afloat in the choppy waters of the AL West and the AL wild card race) and seven overall. Meanwhile, the Royals shocked the staggering Astros by outhitting them and winning two of three, and have caught the floundering Guardians with their offense in the tank. 

So what we appear to be left with are two fumbling Wild Card races that will likely go down to the wire, but somehow manage to seem as though they are occurring in extremely slow motion...]


Monday, September 11, 2023

29-GAME SPANS ≥ TO THE DODGERS' AUGUST: AN EXHAUSTIVE, ELONGATED RUNDOWN...

LAST time we told you about teams that played .800 ball or better over the course of a calendar month (you know: April, May, June, and so on). And we hinted at what's following that up here--a look at all of the instances where teams matched the Los Angeles Dodgers' 24-5 record last month (that's August 2023, in case you're suffering from temporal dislocation).

And so (at left) is the long, exhaustive and elongated answer to a question that none of you (not even Jayson Stark...) had asked.

THESE are all the teams that had a 24-5 (or better) record over a 29-game span (with all of that span occurring during a single season, no "slopovers" from one year to the next). 

There are 116 teams on this list, beginning with the Boston Pilgrims (as the Red Sox were known in 1901) and concluding with the Dodgers 29-game skein (which, unlike most of what you see here, occurred within a calendar month). 

It turns out that there are 191 actual incidences of "24-5 or better" (sounds a bit like an old Chicago song, doesn't it...) because several of these teams had better records during the same year in which they made the list. Many of those "multiple entries" occurred during baseball's early days, when games that ended in a tie were allowed into the official records. But the 2017 Cleveland Indians (you'll find them a good bit further down in the list on the left...) also made the list four times, because they have that many discrete incidences of won-loss records ranging from 24-5 to 27-2--the second-best record ever over a 29-game span, by the way.

For our purposes, however, the 116 teams who did it at least once in a given year is what we really want to know.

AND you're also going to want to know what that darned color-coding means. For once, that's pretty simple:

--Teams shaded in orange are the ones that won the World Series in that year.

--Teams shaded in yellow are the ones that lost the World Series in that year.

--Teams shaded in green are the ones in the divisional era (1969 to the present) who made the post-season but didn't advance to the World Series. 

--And, of course, teams with no shading are teams that didn't make the post-season at all. (Keep in mind that this shouldn't be held against the teams in 1901 and 1902: it's not their fault that the World Series hadn't been invented yet. But the 1904 New York Giants do deserve the blame for not playing in the World Series that year--because they boycotted it!)

As you can see, there have been eleven instances in baseball history where teams with "hot spans" of the type we've defined met in the World Series. But that hasn't happened since 1977.

What seasons produced the greatest number of "hot spans"? The chart gives us the answer: the record for that was set in 1954, when the pennant winners--the Giants and Indians--were joined by the Yankees and Braves as a foursome of "hot span" teams. (The Yankees and Braves would have "hot span" years again in 1957, and that time they did manage to meet in the World Series.)

Years in which three teams had hot span first manifest in 1909, with the Pirates knocking the Cubs out of first place and sending the "hot span" Tigers to their third straight World Series defeat (a feat yet to be replicated, by the way). 

Triple "hot span" teams recur in 1932 (Cubs, Yankees, Senators), 1942 (Yankees, Cardinals, Red Sox), 1951 (Giants, White Sox, Indians), 1953 (Yankees, Dodgers, White Sox), 1977 (Yankees, Dodgers, Royals), and 2002 (Diamondbacks, Braves, and A's).

The summary scorecard for "hot span" teams vis-a-vis the post-season can be seen below at right, where we've broken it down by decade. It's clear that "hot span" teams were more prominent in pre-expansion years, and not just because of the presence of the Yankee dynasty. 

As you can see 72 of the 116 "hot span" teams (62%) occurred prior to expansion (and this is probably our best point for such a comparison historically, since the number of years involved in each time segment is almost the same), with the 1960s proving to be the biggest outlier.

The other strong pre-/post- dichotomy is in the percentage of "hot span" teams making it into the World Series, something that the ever-expanding playoff system will continue to cement in place. 65% of "hot span" teams made it into the World Series in pre-expansion times, as opposed to just 25% since--and that figure is headed sharply downward in the 21st century (3 out of 21, or 14%).

Of course, the silver lining--such as it is--can be found in the number of "hot span" teams that at least reach the post-season. That figure is, as you might expect, climbing in the 21st century--and since expansion the percentage of such teams at least having a shot at the World Series has risen to 82% (11 in World Series + 25 in pre-WS post-season = 36 post-season teams out of 44.

WHICH leaves us (as is so often the case...) on the side of the road, looking at the anomalies: the teams that got hot for awhile, but either couldn't win a pennant or a division--or even miss a wild card slot. Some of these teams are well-known: the 1916 Giants hold the record for consecutive wins, but they finished fourth; the '28 A's couldn't quite stay hot enough to overall the Yankees, but they then reeled off three straight pennants; the '76 Dodgers put a few more pieces together and won two pennants, only to continue their tradition of losing the World Series to the Yanks. 

But there are some truly anonymous teams here as well--ones that never get much attention paid to them because they were also-rans. Who knows anything about the 1916 Browns, or the 1965 Pirates--or even the 2010 White Sox? How about the 1993 Red Sox, who actually finished under .500 (80-82)? Now that we know about these teams, we'll spend some time looking them over; look for a future installment that examines these oddballs...most likely called "Hot Span" Teams As Unreliable Narrators. Stay tuned...

Wednesday, September 6, 2023

HIGH-FLYING MONTHS: THE DODGERS' AUGUST IN HISTORICAL CONTEXT

SO the Los Angeles Dodgers had that white-hot month: 24-5...a feat already fading into a crevasse with the shocking news of Julio Urias' arrest for domestic violence. It's a safe bet that Los Dodgers will not be duplicating their feat (.828 WPCT) in September.

But it leads to a question we've never seen pursued elsewhere: just how often do teams have such high-flying months? Let's set the bar for high-atmosphere flying at a WPCT of .800 or higher. Just how often do you think that teams manage to sustain such a performance level over any given calendar month? And has anyone actually sustained such a level over two consecutive months?

As always, we have Forman et soeur to thank for having that information stored; we'll now unlock it for you. Our TimeGrid™ chart at right shows you just how often this has happened since 1901.

That's a total of 53 times over that span, and we have some color-coding here that adds a more detail:

--An orange-shaded box shows you where teams had two consecutive .800+ WPCT months. (The two teams in question: the 1906 Cubs and the 1912 Giants. Oddly, both lost the World Series that year.)

--A green-shaded box shows you the years in which the New York Yankees had such a month. (That's right, they haven't done it since 1941.)

--Blue-shaded boxes show you baseball's expansion years, which somewhat surprisingly were not collection points for high-flying monthly performances. 1977 was the only expansion year in which teams flew up and over the monthly .800 WPCT barrier--and one of them was the Dodgers, doing so in a league where there were no expansion clubs ('77 was AL expansion only). 

--When you see a number in red type, it's a high-flying month where the team's ERA was 3.00 or higher. And when you see a number in bold red type, it's because both teams who flew high did so with a 3.00+ ERA.

Note that more of these months occurred in pre-expansion times: 33 in sixty years (1901-60). In the sixty-three seasons since, it's happened only 20 times. 

NOW let's take a look at the actual teams who flew high for a month. We've broken the lists up by pre-expansion and post-expansion just to help you keep your eyes from glazing over...

On this chart, we show you the post-season status of the high-flying team:

--Those with boxes around their team abbreviations were World Series winners.

--Those whose team abbreviations are shown in red are teams that failed to make the World Series.

--Those teams with abbreviations in orange didn't play in the World Series because the World Series hadn't been invented yet!

So just 13 of 33 teams with high-flying months during the pre-expansion era went on to be World Champs. That doesn't sound all that great (39%), but as you'll see, it's a helluva lot better than the post-expansion percentage...

Because of the ever-increasing amount of post-season play, it's become harder and harder for teams with high-flying months to actually win the World Series. In fact, in the past sixty-one years (1961-2022 minus 1994...) it's happened only once: the 1984 Detroit Tigers. Only five of the eighteen teams who've completed a full season and had a chance to make it the World Series have done so (we can't add in the 2023 Dodgers and Braves, whose season isn't over yet). 

Oh, and forget about that extra shading on the 2013 Rays...just another friendly goof!

NOTE that the Dodgers have had high-flying months in consecutive years (2022 and 2023). Only the 1912-13 Giants, the 1938-39 Yankees, and the 1942-44 Cards have managed that. And only those Cardinals have managed to have three consecutive years in which one of their monthly WPCTs exceeded .800. Small solace to those St. Looie fans enduring a dismal year in '23, perhaps, but we should never look askance at a singular achievement. 

The accompanying stats are geared around pitching performance. (Getting the hitter data is a more arduous task, but we'll dip into it when some of our other obligations are less obbligato.) Note that the highest ERA for a high-flying team occurred in 1950 (the Boston Red Sox). Only one other team has had a team ERA over 4.00 and had an .800+ WPCT in a month--the Milwaukee Brewers, in April 1987. Fittingly, neither of these teams made the post-season.

We'll be back with a look at high-flying performances in 29-game spans not strictly tethered to the calendar (in other words, 29-games spans that cross over monthly boundaries). There are lot more of those to sift through, so brace yourselves...

Sunday, September 3, 2023

UPDATED MONTHLY PITCHING SUMMARIES THROUGH AUGUST--NATIONAL LEAGUE

Until the AL had its offensive surge after the All-Star Break, the NL was clearly the "hittin' league" in '23. That's for better and for worse, since we've always associated the league that held out against the DH as being the place where we'd see more pitching. So much nuance lost, so little time: someone really needs to slice up the Tango Love Pie™ and toss it in the trash can...

BUT let's not dwell on that when we can sift through some data, even if it has been somewhat compromised by the specter of 21st century reductio ad absurdum. The numbers, if handled in something more akin to the old-school way, still have some tactility to them, and we've got to protect that at all costs against the blowhards building their "empires of exit velocities." So let's let our fingers do the walking in the agglomeration of monthly pitching data, starting with the NL Central:


The Cubs have manage to overcome their May bullpen disaster and play solid ball for the past three months (47-31 from June 1st to the end of August). Their starting pitching is still a bit suspect, however, and they aren't really ready to go very deep into the post-season even if they make it. 

The same can be said about the Reds, who've brought virtually an entire farm system to the majors in '23. The Pirates and the Cardinals have floundered all year, with the Bucs squandering a promising start (just 41-64 since May 1st) and the Redbirds having both components of their pitching shoved down their throat serially and consecutively.

The Brewers remain the only really solid team in the NLC, but they'll need some breaks to get by the league's big guns in October. Now let's look at the NL East:


The Mets' fire sale produced the expected results in August, and brings their '23 season to its "not with a bang, but a whimper" moment. (Oh, and Tommy Pham DID get dumped: he wound up in Arizona, which is probably not his last stop).

The Fish have flopped themselves out of the water after their glorious June (19-32 in July and August) and have stopped gasping for breath, while the Nationals had a two week hot streak (11-3) against cratering clubs that gives them a better result in August than what is really the case. 

Comparing the Phillies and the Braves from June 1-August 31 is more interesting than one might first think, given how on fire Hotlanta has been: ATL 54-22, PHI 49-29. The Phils' starting pitching is actually better than the Braves' at this point, which could make for some interesting occurrences in the post-season should the two teams ultimately collide.

Now it's flyover time, headed back to the West:


The Diamondbacks' starting pitching failed them first; then the bullpen went kaput as well, making them into pretenders instead of contenders. The Padres' bullpen has a collective 8-25 record since May 1st, which has proven impossible to overcome. 

The Rockies are an ungodly mess, with starting pitching that almost makes Oakland's look "good" by comparison (Rox SPs are 23-59 for the year, 10-32 since June). 

We got a little giddy last time about the Giants and Gabe Kapler's "Tampa Bay tiered" pitching staff, but SF is still in the hunt for the third wild card slot, and if the starters can regroup in September, they just might make it. 

The Dodgers were able to put a bandaid on their pitching staff after a rough July for their starters, and they got an historical performance out of Mookie Betts in August to boot, lifting them to a 24-5 record for the month. (We'll cover "great team months" in more depth later this month...) It would have looked even better if Tony Gonsolin hadn't been left in to shred his ERA and his arm...

That said, their current crop of starters don't really seem likely to stop the Braves should it come down to that matchup in the NLCS. 

We will (of course) wrap up these monthly looks right after the season concludes. Stay tuned...

Saturday, September 2, 2023

UPDATED MONTHLY PITCHING SUMMARIES THROUGH AUGUST--AMERICAN LEAGUE

August continues to be the month within the baseball season that tends to shake out the relevant results in the brand of "post-season baseball" we now experience. 

We see teams rise or fall in more definitive ways during this month, leaving some wiggle room for the cadre of Wild Card contenders; and August 2023 is right in the pocket WRT this, particularly in the American League, where one division (the Central) is so crippled in comparison to the others.

The pitching summaries we've devised from data found a Forman et soeur (aka Baseball Reference) give us a solid suite of relevant info for showing how teams rise to the top--which they do primarily through getting the two segments of their pitching staff in sync. Let's go ahead and move right into a look at those AL summries, beginning with the Central Division:


Our color coding is more robust this time around (though it's doubtless missing something...) and we can see right off that the White Sox' sell-off at the trading deadline cemented in place a totally disappointing season for South Side fans. Three out of five months where starting pitchers have an ERA north of 5.00 is going to produce catastrophic results (and the White Sox' record in those three months was 25-54...not quite the uber-disaster experienced by the A's and Royals, but sufficiently bad for the fan base to spend much of its time at the ballpark holding its collective nose).

Cleveland spent the year with an up-and-down pitching staff racked by injuries--the silver lining might be that they did bring a number of promising young starters up in '23, giving them a solid amount of experience that might serve them well for next year. Their last-gasp waiver wire play brought them three more pitchers for an ostensible September "Hail Mary," but only one of those pitchers was a starter (Lucas Giolito)--and a struggling one at that.

The Tigers settled into a fitful mediocrity after the All-Star break, and their arduous sorting-out process is likely to continue well into 2024; the Royals achieved a lamentable consistency this year, in that in every month thus far the two segments of their pitching staff have had a losing record. Perhaps September will break the spell--but don't hold your breath.

Minnesota continues to lurch toward a division title, but their pitching has gone mediocre since June and it will be a miracle if they win a single playoff game.

On to the AL East:


It's turning into one of those rare-but-blissful years where the customary "big bruisers" in the Eastern Division (Yankees, Red Sox) seem all but certain to miss the playoffs. Bad pitching in July put the Yanks behind the eight-ball in July; then anemic hitting sunk them further in August. The Red Sox' bullpen, which had seemingly rounded into shape in July, cratered this past month, pushing them back down the standings.

The Rays recovered from their swoon in July, thanks in part to a vulturous bullpen (9-1 for August). They were still passed by the Orioles, who are currently the only team in the AL with a winning record in every month. Despite adjustments to their pitcher personnel that paid off handsomely in both July and August, there are still some folks who have their doubts. We're rooting for them, however--despite their medieval team ownership...

The Jays have had solid pitching for three straight months, but they just don't seem to generate sufficient momentum that can get them into the race. They'll have a dogfight on their hands to claim a Wild Card berth...but don't count them out.

And now to the Wild West:


Talk about a dogfight: the two Texas teams and the Mariners are now neck-and-neck, and September head-to-head match-ups will be extremely interesting. The Astros' bullpen seems to be returning to form just in time to help them, but they're going to need more consistent starting pitching. 

Seattle and Texas seem to have their pitching staffs in solid shape heading into the stretch run, though the Rangers have been more up-and-down and still have some bullpen uncertainties.

The Angels simply crashed and burned, so much so that we missed the blue color-coding for their component performances in August (there should be blue--which is the code for the worst; orange--no longer the new black--is the best). Truth told, their pitching was always iffy, and Shohei Ohtani's injury was the poisoned last "flavor straw" that leaves yet another scent of ash in Anaheim.

The A's starting pitching is something not to behold. Add up that won-loss record and you'll be looking for a bed to crawl under: that's right, that end-of-August total was 13-60. But they're playing the Angels this weekend, and their starters are 2-0 in September. Better take a snapshot of that quick...

We'll return with the NL summaries maƱana. Stay tuned...