Sunday, September 19, 2021

WILL SCHEDULE STRENGTH DETERMINE '21 POST-SEASON PARTICIPANTS?

Here's just a quick look at the data relevant to the question posed in the title...we've included Tampa Bay, San Francisco and Houston because they are all still in the hunt for a favorable slot in the post-season, as opposed to grabbing a wild-card slot. 

It's been a fluid year, and despite whatever misgivings one might have about the state of the game on the field, the higher quantity of teams still in the hunt for the post-season does mitigate those concerns, as the emphasis shifts to specific teams and their need to win.

Here is the data, with the explanation for the color coding following below:

Dark orange represents home games against teams still in the playoff hunt.

Light orange represents home games against teams no longer in the playoff hunt.

The darker shade of blue represents road games against teams still in the playoff hunt.

The lighter shade of blue represents road games against teams no longer in the playoff hunt.

When one eyeballs the color coding, what emerges is that the Red Sox, who've been floundering for much of the second half of the season, seem to clearly have the easiest set of opponents, even though they are playing the most road games. The problem for them, though, is that they are not an especially good road team.

The teams with the toughest remain schedule appear to be the A's and the Padres, with the Yankees next. The Rays are right there with them, but Tampa has a 7 1/2 game lead and a fold now would be something akin to the phamous phold by the Phillies back in 1964.

Speaking of the Phillies, they still have a chance to overtake the Braves, who've lost four in a row going into today's games. One senses that only one of the two NL East teams will make the playoffs. In the NL Central, the Cards have opened a lead, but they have a tougher remaining schedule than the Reds. These two teams are likely vying for the somewhat dubious chance of playing either the Giants or the Dodgers in the wild-card "bakeoff" game.

The team not yet discussed: the Blue Jays. They have a reasonably favorable schedule, and their team has been coming together more consistently than any of the others in the AL East. They have what people like to call an "exciting young club," and Vlad Jr. looks like a chip off the old block. 

No predictions here, but if rooting from knee-jerk underdog mode, one might hope for a finish like this:

AL HOU-CHW-TBR wildcard OAK-TOR

NL SFG-MIL-PHI wildcard LAD-STL

(We flipped a coin between CIN and STL, and our pal Brock Hanke--born, raised, and all-life resident in St. Louis, intercepted the coin in mid-air.)

Your mileage may vary, of course. Regardless of how it turns out, a baseball September of anticipation is something to savor. With so much other unwanted uncertainty, here at last is some suspense that we can actually enjoy: go for it.

Sunday, September 12, 2021

THE "UNHITTABLE" AUSTIN ADAMS & MORE SLOWLY DEVELOPING BASEBALL EXTREMITIES

It's a truly bizarre story that will certainly be mainstream by the time you read this: Padres reliever Austin Adams, possessor of an "unhittable" slider, is on the brink of the most astonishingly extreme seasonal record in baseball history.

Earlier today, Adams hit three batters during a relief appearance against the Dodgers (in a game the Padres lost, 8-0). That brings his total number of HBPs in 2021 up to 23 and counting, which apparently ties the "liveball era" (1920-) record for HBPs in a season. (The record since 1901 is apparently 27, but is much higher than that when you go back into the nineteenth century, when some pitchers accounted for 80% of a team's IP in a single season).

The first staggering fact about Adams' 23 HBPs is that they have come in just 48 IP, a ratio that is so elevated from the pace of any other pitcher with similar HBP totals that it beggars comparison. (OK, OK: let's think about the wheelbarrow as opposed to a rocket ship...that should be about right.) 

The second staggering fact is that, until 2021, there was little or no indication that Adams would suddenly corner the market in plunking batters. Without a doubt, he's been wild at every stop on his way to MLB: he had a lifetime 5.8 BB/9 in the minors. He'd hit 32 batters in 340 minor league innings. But prior to this season, he'd hit just 2 batters in 42 lifetime IP since making the majors in 2017.

As noted, Adams' slider, which now seems to be spinning out of control at a rate exceeding even the diligent overreach of the Statcast crew, is "unhittable." Of course it is: he's hitting so many batters that nobody can take an actual swing against him. 

Right now, Adams is on the cusp of another unthinkable record: he might actually wind up with more hit batters than hits allowed. His totals are now officially in a dead heat--23 apiece. 

Our first guess is that he's another victim of the Spider Tack™ crackdown: without enough "stick-um" to center his "eccentric, high-spin slider," he's simply at sea right now. But his '21 game logs don't really support this idea--his HBPs have been coming at a regular interval throughout all the months of this season: it's not as if he's just suddenly hitting everyone he faces in a parallel variant of "Steve Blass Disease." Of course, now that he has entered the record books and will be receiving national attention, this might mushroom further...we'll just have to see how it plays out.

The Padres, in a September tailspin that's put their post-season chances in jeopardy, are likely to make Adams' appearances a good bit more scarce. (Today's appearance came in a game where San Diego was already down 7-0.) But team rosters are tighter in September than has been in the case in the past, so they may not be able to just sit him down. Stay tuned...

Extremity (and its diabolical cousin, extremism) seems to be radiating itself ever more insistently into people's lives, and Adams' sudden case of target practice is merely a surreal reminder of that fact. In most cases, extremity/extremism takes time to build up (and this is a good time to remind Ben Lindbergh that he's still wrong about his dismissal of the "frog in pot" syndrome--it's called metaphor, Ben!)...and once allowed to fester for a foothold, it can explode into a forbidding level of prominence. To take a Jackie Robinson quote out of context: "baseball has done it!"--and we're here to show you just another example of that, so you can see what the "heroes and villains have done done" this time.

Those enamored with those pesky Three True Outcomes often overlook that the rise of the phenomenon applies more to one segment of that troika than the others. Namely, strikeouts. How the "frog and boiling water" metaphor applies here can be measured is by counting how many hitters are allowed to play at least semi-regularly while amassing a staggering percentage of strikeouts per plate appearance. 

As hard-throwing relievers proliferate and their percentage of inning pitched increase, strikeouts have soared. While there is a small sliver of hope that the rate of this increase has finally slowed, it's still instructive to see what has happened to the game's attitude toward hitters who swing from their heels with ever-increasing abandoned and rack up K/PA ratios that would have stupefied even 1960s-70s ballplayers, much less "inside baseball" ideologues like Ty Cobb

Striking out in a third of one's plate appearances for any batter with more than 200 plate appearances in a season simply didn't happen for 111 (that's one hundred and eleven) years after the founding of the National League (1876). It first occurred in 1987, when Bo Jackson struck out in 36% of his plate appearances. We won't provide you with a list of all those who've followed in Bo's footsteps since '87, but we will note that there are now two hitters--Miguel Sano and Joey Gallo--who've struck out in at least a third of their plate appearances in every single one of their years in MLB. They won't be the last...

The chart at left shows how the frog got into the pot, and how the water got incrementally warmer over time. And the data shows that we are getting closer and closer to a boil, particularly as the game went all-in for "launch angle" and other related "home run derby" approaches to hitting.

The frog is still in the pot, but the cat is out of the bag. Even if things plateau in the next several years, it's highly likely that the numbers of such high K/PA guys will continue to grow, and we'll see somewhere over 100 such seasons in the upcoming decade. This cautionary prognostication is a reminder that extremity (and extremism) is hard to get rid of once it's been given a toehold.

Thursday, August 19, 2021

W(H)ITHER OHTANI?

So Shohei Ohtani now has 40 HRs...the last coming on August 18th (as he also continued to make a strong case for the MVP Award by throwing eight strong innings, improving his '21 won-loss record to 8-1). 

It's the dual thing that's truly special, of course, but the Angels--missing Mike Trout for more than three months due to a calf strain that has apparently taken on epic proportions--aren't going anywhere in the pennant race. Thus the media is still making a bigger to-do over Ohtani's HR total, even though (as we will see) it is only mid-pack in terms of "per-game pace" since the end of the dubious century and the beginning of the downright rotten one.

Don't misconstrue (or, as Marvin Milkes used to say to Jim Bouton, "misconscrew") what we're saying: Ohtani's HR pace is impressive. The chart below, however, takes a good bit of the gasbaggery out of the  lingering heavy breathing. As you'll see, Ohtani is tied for fourteenth on the list of 21st century HR leaders as of August 18th. 

We gathered up all the leaders from 2000-2019 and 2021, including the folks below Ohtani (in order to provide total context) and added in their final HR totals for the year in question. The hitters who hit 50+ HRs in these years have those totals shown in bold type: 13 of them made it across that line.

The average % of HRs added from August 19th to the end of the season for this group works out to 19%. If Ohtani matches up with that average (a rare feat: as you can see, the %'s are all over the place), he'd wind up with 49 or 50 HRs for the year.

Perhaps a more useful mode of assessment, however, is to look at the Angels' remaining schedule and examine how Ohtani has done against the teams he'll be facing. The Angels have seven games left with the Astros, and six each with the Mariners and the Rangers. It turns out that these teams are three of the four teams Ohtani has struggled with the most in '21: he has an aggregate batting average of .213 against them (though he has hit a total of nine HRs against them, over a total of 36 games).

If he matches that HR pace in those 19 games, he'd hit 5 more homers against them. That leaves 21 more games on the schedule, with Ohtani's biggest opportunity coming up in the next 7-10 days, when the Angels will face the pitching-strapped Orioles at Camden Yards, where they've given up nearly two HRs a game this year. If there is any place where Ohtani is going to redeploy his prolific home run stroke, Camden Yards is it. (We will be very interested to see if Joe Maddon decides to push back Ohtani's next start, which is scheduled for that series: doing so would allow him to concentrate on his hitting and permit him to take his next turn on the mound at home, where conditions are more favorable.)

If Ohtani could hit four HRs in Baltimore and match his pace in the games against the Astros-M's-Rangers, he'd had 49 HRs with 18 more games still unaccounted for. That would be the scenario that would give him a very good chance to push his total into the mid-50s and fully justify all the heavy breathing we've been surrounded by since his magical six weeks before the All-Star break, when he hit 18 HRs in 34 games. As we always like to say at this point: stay tuned...

Saturday, August 7, 2021

SNAPSHOT: TOP HITTERS IN 2020-21 & WHERE THEY PLAY

We are just at the point where the number of games played this year, when combined with the abbreviated 2020 season, gets us to totals that approximate a full season...so we thought it would be a good time to take a look at the top 125 hitters in baseball over that time frame. (We are using OPS+ as the measure here.)

A few notes are in order. First, it is highly unlikely that there has ever been another time when four hitters aged 23 or younger were in the top ten, as is the case right now (Juan Soto, Fernando Tatis Jr., Vladimir Guerrero Jr., Ronald Acuña Jr.). Second, Shohei Ohtani (who has been pitched to with increasing care since the All-Star break and is currently in a tailspin) does not show up at the top of this list when his 2020 performance is taken into account, suggesting that we are seeing either a prolonged hot streak and/or a career year. (Time will tell.) Third, Brandon Belt--kicked around by his fan base for years--has benefitted from the dimension changes in his home park and is taking advantage of it in a belated career surge. Fourth, comparisons between Mike Trout (suddenly fragile) and Bryce Harper (suddenly consistent) are almost becoming valid again. Fifth, the players whose names are shown in lighter blue than the rest are all members of the Los Angeles Dodgers. How in holy heck did they manage to get Trea Turner in that deadline deal? 

That last note prompts us to look at from where all of these players (and the 99 others on the wall we are not showing you lest you start taking them off the wall and force your fellow readers to break into off-key song) are currently collecting their paychecks (some meagre, some incredibly bloated). The Dodgers have six fellows in the Top 26 (per the above chart), and eight overall--not including a guy (Cody Bellinger) who won an MVP Award in 2019. If their bullpen wasn't snakebit (1-12 in extra-inning games), things would be a bloodbath. Hell, they might still be a bloodbath...

Add up the totals in the last three columns on the right and you'll get a general sense of which teams have the best offense. The Giants, transformed into an extra-base hit juggernaut this year (will it last? we think not...) are even better than this presentation suggests, given that Buster Posey (160 OPS+) is just under the 300 PA threshold needed to appear on this list.

There's an intriguing surprise for Motor City fans who've been waiting for at least half a decade for signs of life in their beleaguered Tigers. When we focus in on the top two tiers of top hitters (covering the folks in the Top 70), we see that the Tigers have developed a cluster of young swingers who might just be helping to lead them out of the wilderness. The list of the top number of hitters in the Top 70 by team goes as follows: Dodgers 8 (!!), Giants 4, Yankees 4, Padres 4, Blue Jays 4...Tigers 4.

It's a slender thread, but it is a thread. We'll see if it frays, or turns into a stitch. In the meantime, folks in Detroit can take solace that they are not living in Dallas, where the Rangers have no hitters in the Top 70, or even in the Top 125, now that Joey Gallo has been shipped off to New York. Though Joey did not personally spurn his fan base in Big D, his departure could result in many of his fans switching their daily allegiance to his close relatives Ernest & Julio, who will at least help them drown their sorrows...

Friday, July 30, 2021

THE FAT BRIGADE FIVE YEARS ON: ROLY-POLY MOUNDSMEN ARE STILL HOLY...

If you have the gut(s) to read the back pages of this rag, you will know that we are enamored of obscure, overweight pitchers. You know: the stocky, portly types who look like their uniforms are going to burst at the seams if they make the wrong move at just the right time. 

These are the guys who clearly have sub-standard "stuff" in an world where the burgeoning variants of Ye Olde Big Unit are malevolently prevalent, capable of casting shadows over home plate while standing on the pitching mound. These fellas struggle to make the cut even in the "disposable diaper culture" of interchangeable "last men" who scratch and claw for the twelfth (or even thirteenth) slot on a pitching staff, clinging to life by a hangnail. 

They are all about 5'10" or 5'11" and weigh in between 215-230 lbs. Most of their major league careers are perilously short and self-liquidating, since that body shape doesn't (shall we say...) inspire confidence. Many are Latino, and we risk charges of stereotyping when we tell you that in their street clothes they are indistinguishable from the guys driving all those gardeners' trucks in the verdant suburbs of the increasingly clotted "land of the free." 

Yes, all of these guys have guts--but they have the guts of cat-burglars. It goes with the territory, for they know that if things go belly-up, they have an excellent chance of actually driving around in those gardeners' trucks sooner than later. And you can't blame them for wanting to postpone that for as long as possible...

Some time ago we rhapsodized (briefly, for the reasons stated above...) about two of these wobbly warriors: Erasmo Ramirez and Vidal Nuño. That was back in 2016--and a few things happened to intervene with ongoing coverage of these two and their lo-fi high-wire act. Both men are still pitching; Erasmo is still in the big leagues, with the Tigers--the fourth team he's been with since we wrote about him in 2016. 

Vidal--as is often the case for penny-wise/pound-foolish pitchers--had his best year in 2018 with the Rays, and hasn't been back to the big leagues since: he's been on the lam to Mexico at least once in the intervening years, and currently has an unsightly bulge of an ERA while surfing on a hangnail with the Dodgers' AAA farm team in Oklahoma City. 

We wish them well, but wishing and hoping is probably not going to cut it for this duo. But fear not: we've located a new duo with all the defining characteristics of this raggedy archetype, including the happy congruence of a lefty-righty combo. And these two estimable avatars of avoirdupois are--as of this writing, at least--actually starting for their two teams, as was the case for Ramirez and Nuño back in the day.

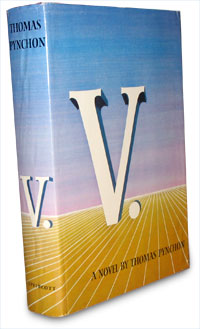
The lefty is Nestor Cortes Jr., pitching for the Yankees. Nestor is sort of the Benny Profane of the Yankees, their version of a human yo-yo, who keeps coming and going and coming back again, having made side trips to the O's and M's only to wind up back in the Bronx. A slop artist with a series of tricky delivery points, and a toe-tapping delay tactic that must be seen to be believed, Nestor has parlayed his entire arsenal of chicanery into a (tenuous) slot in the Yankees' starting rotation, where he currently has a 1.93 ERA.

Nestor is 26, and while one can legitimately surmise that he's overachieving, he is a bonafide prospect (his lifetime minor league ERA, including several stops at AAA, is 2.57). Things are less certain for our new-but-old righty, 34-year old Paolo Espino. Here is the more typical story that applies to one of these chunky fireplug guys: it took ten years for Espino to make it to the big leagues, doing so only after two teams (the Indians and the Nationals) gave up on him. Ineffective for two teams (Brewers and Rangers) in his 2017 debut, he bounced around some more, finally hooking back up with the Nats, where a series of injuries to big-name (and much, much taller) pitchers opened a path for Espino in 2021.

Paolo is a good bit more susceptible to the long ball than Nestor (he gave up three HRs in a recent start against the Orioles, of all people) but overall he has pitched well for the Nats, posting a very solid 3.08 ERA. It must be said that his best outings as a starter (8 GS thus far) have been against the weakest hitting teams in the NL (Pirates, Mets, Marlins); but with Max Scherzer now in Los Angeles, it appears that he'll at least be given enough rope over the remainder of the '21 campaign. 

We'll be rooting for him--and for Nestor, too: it's what we do. (And so should you.)

Wednesday, July 7, 2021

SO HOW ARE THE SMALLFRY DOING THIS YEAR?

The topic of players whose height is 69 inches or less is one we've touched upon briefly in the past; a full-scale study would be useful and entertaining, but it would not refute the common wisdom that small players face an increasingly uphill battle, even in baseball. We limit ourselves in what follows to position players--pitchers who are 5'9" or shorter are scarcer than those proverbial hen's teeth that writers seem compelled to bring up whenever they confront anything that appears to be dwindling.

So we'll focus on the present-day here, with a light dusting of historical data, leaving the 100+ page essay with its recondite rediscoveries for a later time. We'd noted previously that shorter-stature players were making a comeback from what looked like a road to extinction in 2012-13: the emergence of 5'9" Mookie Betts and his (still singular) season of radiance in 2018, along with the continuing presence of 5'6" Jose Altuve, has made the "not very tall" observation made by the impossibly leggy Martha Vickers in The Big Sleep a bit less pejorative in these otherwise parlous times.

Betts and Altuve have been joined in by Cleveland's Jose Ramirez as a troika of pint-sized competence; all three are continuing to perform creditably thus far in '21, where they've been joined by seven other short-stature players whose OPS+ currently exceeds league average.

Among those seven other smallfry is Cedric Mullins, who has become a consistent bright spot for the otherwise dismal Baltimore Orioles (28-57 as of this writing) by adding power to his speed-and-defense skills. Mullins just completed one of the finest monthly performances in recent memory, hitting .380 in June with a .720 SLG: while he was overshadowed by the 13 HR-fueled 1.300+ OPS of 6'4" Shohei Ohtani, it's not impossible to argue that Mullins actually had a better month, given his defense (a series of highlight-reel catches in CF) and speed (7-for-7 in SB). While Ohtani foregrounds his pure physical skills and his unique two-way excellence, one can argue that Mullins is currently the more well-rounded player--and all of this in someone who stands just 5'8".

If Mullins can sustain a solidly above-average offensive performance in the second half of '21, he could become just the 158th "smallfry hitter" since 1901 to achieve a seasonal adjusted OPS (OPS+) of 140 or higher. He'd join another smallfry Oriole centerfielder, Al Bumbry, who achieved this feat back in 1973. (Bumbry, however, did it as a platoon player, amassing just 395 plate appearances that year: Mullins is within striking distance of that number in early July and figures to be an everyday player on a team that needs every at-bat they can get him.)

As the historical chart (presented in our patented "decade-year"-style table) demonstrates, "smallfry excellence" (if not "smallfry-ism" itself) became endangered a long time ago and has remained a rare occurrence since the mid-1930s. With Mullins, Ramirez, Altuve and Betts (who, somewhat surprisingly, has only had one season--2018--where he's exceeded a 140+ OPS) all in the running, this could be the biggest year for "not very tall" hitters since 1953, when Yogi Berra, Roy Campanella, Hank Thompson and Gene Woodling all had OPS+ values higher than 140. 'Tis a consummation devoutly to be wished...

Monday, July 5, 2021

EARLY JULY '21: SIGNS OF A RUN-SCORING BIFURCATION BETWIXT LEAGUES...

So...we have shameless generated a month-by-month log of run scoring per game per team, summed up into each league, that goes back to 1901--it's interesting data, though semi-vulnerable to the slangy arrows of feckless young quants (following the lead of flatulent old quants who should've been forced to do something else for a living...) sullenly alluding to "sample size issues." Don't let that deter you from perusing it anyway, as it provides fascinating topographic perspective of run scoring, its range of fluctuation, and--perhaps most intriguingly--the oscillating differences between the two leagues as captured in many snapshots (a total of over seven hundred on the full chart, in fact).

Now naturally we're not going to print that whole darned chart here--the BBB blog format is more than a bit unforgiving with such visual excess--but we'll give you a slice that portrays the last fifteen years. (That's what they used to call a "free sample" before everything became "bait and switch.") Here 'tis:


Now what you have here are R/G by month for each league, plus the difference between the leagues for those monthly values, from the tail end of the long offensive explosion that ran from 1993-2009 all the way up to this year. 

All monthly R/G values of 5.00 or more are shown in bold type; those monthly values under 4.00 are shown in red. The highest monthly R/G value for each year in each league has a bold box around it.

This is, as our friends in the cereal industry like to say, a more granular level of run scoring data, showing fluctuations and some patterns for each league year as it plays out. The color-coding tells us that the NL had the most serious run-scoring downturn in the past fifteen years, with that situation becoming chronic from late 2012 through mid-2015. 

What the figures in blue show, however, is not a lot of real difference in R/G between the leagues over recent years. (You will have to trust us for now when we say that this was less the case in other periods of baseball history--the 1920s, 1930s, and 1980s, for example.) We've bolded the differentials of three-fifths of a run (0.60) or more; until we ran into some kind of buzzsaw last month (that's June '21 for those of you keeping score at home...), we had not had a league differential that high since 2011. (Note that the darker shade of blue indicates when the NL had the higher R/G value: eyeballing that pattern will indicate that this is a relatively rare occurrence.)

In 2019, the egregious "homer explosion year" (hopefully an all-time record that will never be seriously approached again) did not produce serious run differentials (four of the six months showing a difference of less than a tenth of a run either way). And that was representative of what we'd seen since September 2011.

But in 2021, as noted, something shifted last month. After two months of relative run-scoring parity, we had a notably divergent June thanks to an AL homer surge (1.39 HR/G) pushing them back over 5.00 R/G, while the NL languished at its same lower-than-historical lifetime run-scoring rate, with its HR/G rate remaining steady at around 1.1 . That run-scoring delta (0.67) could be a transient phenomenon: they often are. The very early numbers in July, however, seem to suggest an even bigger separation (those figures shown in grey).

In our most recent post we suggested that the game be overhauled into three leagues based on run scoring levels; for the moment, at least, it looks as though baseball is trying to take us up on at least a portion of that idea. (We still think breaking up the leagues is the best approach for the game in the long run, but performing such upheaval on such an essentially conservative entity such as baseball is a long shot.) 

How long will this run divergence last? There is a tendency for this phenomenon to persist once it manifests itself: a look at the full chart (as noted above) shows such a pattern as recently as the 1990s. Another era of bifurcation may well be upon us--stay tuned...

Thursday, June 17, 2021

PARKYAKARKUS FOR A PROPOSAL MAKING BASEBALL THREE SHEETS TO THE WIND...

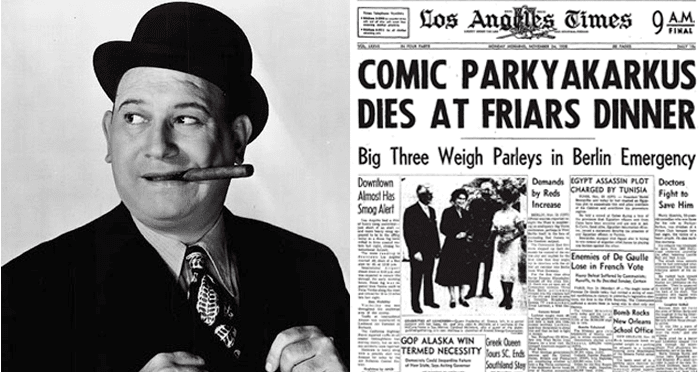
So--how can something as moot and moribund as a dialect comedian be the catalyst for The Most Subversive Plan Yet™ to save baseball from its lingering case of sepsis? Well...first of all, pally, we're not talking about just any dialect comedian: we're talking about Harry Einstein (the father of Albert Brooks), who made a brilliant comeback at a Friars' Club Roast in 1958 only to die right on the spot. 

That's right, the man who called himself Parkyakarkus parked his carcass in the lap of Milton Berle, and never opened his eyes again. File it under "brilliant but doomed," ticking time-bomb division. And baseball, with an encroaching sepsis (alarmingly high ISOBA) as sludgifying as any collection of clogged arteries, is in dire need of a transplant--but, characteristically, is unwilling to consider even a bypass operation.

So--what the hell, you say? Where is the oxygen in relation to your brain, Mr. Big Bad Baseball man? Put up or getyakarkus off the operating table, already. 

OK, OK. We had a brilliant (but doomed) revelation yesterday (when all our troubles weren't nearly far enough away). It welled up from having glanced at 2021 baseball stats sorted by ballpark. As that other song goes, just one look was all it took, and we knew how to save the game from parking its own carcass at the feet of its (former) fans.

The ballpark data confirmed what we see in so many aspects of America's current malignity. We see fracture so advanced that there is little if any chance that the current crumbling edifice can be kept intact. We see backlash and denial; we see people who believe that they are entitled to cheat. And we have those who respond to all that with hand-wringing and a pandemic of glib catchphrases that do not exceed 280 characters in length. 

Come to think of it, America has been "lurching"
for the past sixty years...
American society is lurching between death rattles, but baseball actually has a high-concept bypass operation staring it in the face that will give its fan base clear choices for the type of game they want to see. Unlike America, where too much of the data is fudged, baseball can't help but bring us the truth. 

And while the powers that be will never implement any of what follows due to their kryptonitic desire to follow their not-so-inner death wish, we can lay out the surreal, brilliant-but-doomed (mooted?) path to baseball bliss that will, as promised in the title of this blog post, lead the game into a state of being best described as "three sheets to the wind."

The key is in the ballpark stats. They show us that there are three separate platforms in operation within the game today, exacerbated by all of the machinations in wake of Moneyball and the deadly rise of ISOBA ("high isolated power = hypertension" fed into "declining batting average = ongoing onset of congestive heart failure"). While "launch angle" and "three true outcomes" and "Fangrafia sociopathis" have produced rampant infection within all of these platforms, counter-movements in pitching (up to and including the "all-American stick-up" that will produce an untoward amount of clickbait as the '21 season lurches along) have established a beachhead in ten ballparks, with several others showing signs of bringing a low-scoring variant of "homer derby ball" into play.

You can see those ten parks in the top portion of the table at right, where runs per game (per team) strongly resemble what some folks remember from 1967-68. These parks have been sorted in descending order of HR/G, and that method shows us that it's possible to hit homers at the league average rate (the hitters thus far in Yankee Stadium) and score only as many runs as is the case in the stingiest homer park in MLB (down in Miami).

We'll exclude that middle section (in pale orange) for a moment to pimp for the Big Contrast that's tangled up in blue. Here is the game as some will remember it from 1996-2002: run scoring galore, including several parks where the homers are like a July 4th fireworks show every night. Note, though, that even this group brings us several anomalies: robust run scoring with relative modest homer totals (Fenway, Chase, Coors, and Kauffman, where the aggregate batting average is between .265-.275 and folks still hit doubles at the elevated clip common during baseball's fin de siecle).

Perhaps you can see where this is going: we have ten teams in what we've fancifully called the "pitchorama" category, and ten teams mimicking the offensive explosion, which we've tagged as "batorama." That leaves ten teams, who are variously and variably following what the Buddhists have been known to call "the Middle Way." (They are not really a perfect fit, though they are at least linear in terms of run scoring. The "Midway" league will initally possess a bit of both approaches as opposed to forging its own unique style: but that's what the baseball brain trust has thrust upon us, particularly in the years that coincided with the Orange Menace.)

So--here's your oxygen for a game that is running on fumes: we go one better than Solomon by splitting the baby into three parts. That's right: three leagues, three ways that split the game into at least semi-distinct visions of its once and future self. While we are not (yet) getting three distinct styles of play (the work of the post-Moneyball wonks, the Statcast shills, and their enablers has kept that trend firmly under wraps, particularly in the last five years), we just might find that if you divide the game into segments that trend toward a inherent "run scoring aptitude," those games will develop in different directions and develop some truly unique characteristics.

How does it work? In fact, Mr. BBB, just how the hell can this work? How in blazes does your post-season operate, anyway? Amidst a wide range of possibilities, we (as usual) favor something outlandish and baroque. But, in the interest in getting at least a plurality of our readership to take this idea seriously, we offer the following semi-straightforward approach:

1) Each ten-team league has two five-team divisions. 2) Division winners (a total of six) and the wild-card team with the best won-loss record from the three leagues are given a "bye" while the two wild card teams with lesser records play a sudden-death game to reach the playoffs. 3) Once team #8 is determined, the playoffs proceed through first-round (taking us down to four teams), championship series (taking us down to two), and, finally, the World Series.

All of that is disturbingly prosaic, we admit. But fear not, we have saved the baroque stuff for how the regular season operates...

1) Within each league, teams play their four division opponents fourteen times, for a total of 56 games. 2) They then play their five opponents from their league's other division eight times, for a total of 40 more games. 

That's a total of 96 games, and we need to schedule 66 more games to set up the standard 162-game season. 3) We do so by having each team play six games (the equivalent of a home-and-home series) against eleven teams from the other two leagues--which creates a very robust (and at least semi-baroque) interleague schedule. 

In fact, with so many interleague games, a secondary post-season race could actually be superimposed into the playoff design, where the team with the best interleague record who did not win a division or qualify for the wild card via a 162-game won-loss record would be awarded the ninth slot instead of a third "standard" wild-card team. (The only caveat we might want to impose is that such a team must at least have a winning record; if not, then the third wild-card team is chosen in the standard manner.)

So--there you have it. "Designer baseball" with leagues offering distinct styles and statistical emphases. To be successful, teams will have to adapt to other ballparks and (potentially, at least) other distinct styles of play, in a manner similar to but somewhat different from what is the case at present.

Of course, if your team is not playing the type of baseball that you find most gratifying, you may have to change your allegiance. But perhaps it will still be reasonably recognizable as baseball: after all, that's what those who push back at those who criticize today's "homer derby" game. And perhaps folks will pick up on the nuances that shift due to the level of run scoring that this approach would attempt to "bake into" the game.

But that's where the rub comes in--what if all this ballpark stuff is more random than what's being represented here? Will teams try to re-calibrate their talent to escape or transcend the run scoring "channels" they may only superficially (or temporarily) belong to? How stable are the run-scoring constructs that formed our three leagues?

Glad you asked. (Actually, we asked for you, but pat yourself on the back anyway--this has been a long slog.) We combined the in-process 2021 ballpark data with its 2020 counterpart to see how it shifted things around. (We weren't too worried about team movement from one league to the other--that's something that could happen as part of this construct...another "beyond baroque" additive: after all, why shouldn't teams move from league to league? You say it's never been done?? As any number of officious butlers in most if not all of Preston Sturges' comedies would say: pish-posh. So many things are simply for the birds, but too much tradition is an albatross.)

We were more concerned that the tripartite structure that cohered in the '21 ballpark data would get muddled. But as you can see from our revised league set-up using multi-year data, that didn't happen. The impact of baseball's feverish embrace of high ISOBA seems likely to keep this tripartite structure reasonably intact for some time to come (until they break the fever, at any rate).

In this version of the three-league setup, six teams (shown in bold) shifted around, but the overall separation of run-scoring between the leagues did not tighten up egregiously. This version of the "Midway League" might be a bit too close to the overall model of "Orange Menace-era" baseball for our (and possibly your) taste, but the linear structure holds--and with it, the hope continues to spring eternal that a more free-wheeling game can emerge from the parked carcass of what we've been handed by the so-called "best and brightest." 

And, of course, the post-season will redeem almost anything, since it separates the Yankees and the Red Sox from the former AL East and gives them a chance to do something they've never done: meet in the World Series. 

Do we like this better than our four-league concept that we pitched not so long ago? At this moment in time, yes. Baseball may have limited opportunities to expand over the next few years, and it takes thirty-two teams to make a four-league setup viable. 

Something like this, that revamps the existing system in a creative (and quirky) way, that opens up some possibilities for evolving distinct styles of play--and that takes away the medieval feel of the two-league arrangement with a post-season free-for-all that makes any World Series combination possible--feels like a much-needed breath of fresh air. 

(Of course, we still want that 190-foot rule...and wait till you see what else we've come up with. But let's not make poor Harry Einstein spin in his grave just yet...)

Monday, June 14, 2021

CRACKS FORMING IN THE "STICKY WALL OF PITCHING"?

Shameless overkill by SI: par for the course.
The question lurking behind the "sticky" pitching situation in MLB '21 is more about injury than it is about cheating (a subject that has haunted those overheated media minds for the better part of a quarter-century). 

Make no mistake: pitchers are cheating. However, what they are doing--as was also the case with those viperous villains from Houston--is actually not helping them as much as folks believe. Added RPM (an overblown stat, since it purports to measure something that has an actual duration in fractions of a second...) is in no way a panacea for pitching success: those hurlers who pursue such a path sacrifice location for movement, only to discover that some pitches just don't move. Hence a rising group of pitchers who give up more homers per hit than in any time in baseball history.

More pertinent to the ongoing fracas about the state of the game--where the age of analytics has pushed hard to join what has become the ongoing American pastime: wall-to-wall distortion--is the fact that a full season's worth of games is being attempted in the aftermath of a world health crisis, which in 2020 limited the baseball season to just 60 games. We have now passed that threshold in 2021, and a breakout of pitcher performance data is suggesting that cracks are forming in the early-season ability to keep batting averages at historically low levels.

Now a "crackdown" on illegal substances, which seems to be getting handled with baseball's utterly bizarre version of kid gloves, may soon be trumpeted as the cause for what looks like a partial meltdown of pitching performance. But other factors are at least as likely for the decline in effectiveness that we've been seeing over the first half of June. For one, injuries and the substitution of inexperienced and ineffective pitchers. For another, some amount of adjustment by hitters that is starting to replenish one of the most depleted commodities in baseball over the past several years: the single.

A look at the monthly ERA figures for teams in both leagues--first in aggregate, then broken out by starters and relievers, shows that the "cracks" to which we allude are, in fact, large fissures in the American League. 

No fewer than nine AL teams have an aggregate ERA over five for the first half of June: the contrast with the number of teams showing such high ERA figures in April and May is stark. (It's even happening to the Yankees and the Red Sox...)

As you'll see, these figures are far less pronounced in the NL, at least thus far. While several AL teams are showing a dramatic and sudden reversal of form in June, most of the NL teams struggling this month are ones who've been doing so all year long (the D-backs, Reds, Rockies and Pirates). Only the Cardinals are showing a sudden reversal of form.

Of course, the interesting thing is that none of the fourteen teams whose team ERAs are ballooning in June is currently in the crosshairs of the frantic exposé that SI and others are fourth-gearing into what is already a highly fraught national conversation about the not-so-grand old game.

So many issues are competing for attention in baseball's malaise that it is becoming genuinely hard to tell the players without a scorecard--or an annotated list of the axes they are grinding (sometimes more than one, simultaneously--more on that in several future installments). Baseball may be escaping one of the slings amidst the flying arrows--that run scoring is anemic. But the problems that the game faces are not solved--and they are not successfully swept under the rug--by a boost in run scoring toward "historically average" levels (another distortion of the facts, led by two highly voluble sabermetricians, who spend most of their time on Twitter engaging in glib misdirection).

No, it's the shape of offense and the attendant rituals that have built up around this bloated variant of baseball that is attenuating the game on the field. For now, though, let's stay on course with the direction that pitching is going now that the year is moving into what promises to be a long, hot summer. 

As you can see, starting pitching is decaying in quality in both leagues. (Some of this is due to the fact that certain teams--the Twins, the Royals, and the four NL suspects mentioned earlier--are getting even worse; but 21 of baseball's thirty teams have an elevated starting pitcher ERA in June.)

Batting average is rising, but there is a seesaw effect in the game right now that has to do with differences in ballparks: thus far in June, it's been a month where the more hitter-hospitable parks have been in play. That will change over the next couple of weeks, so we'll have to check back with the final June numbers to see how it plays out.

Relief pitcher performance is showing a pattern that is much more mixed: NL teams are showing an overall improvement in June, while AL relievers are following their starters into a pronounced funk. If such a pace continues, we might wind up with one of the more pronounced performance differences between the leagues in quite some time (and it won't simply be due to the fact that the NL went back to having pitchers bat, either: that's another canard from that Tango Love Pie™ perpetual deflection machine). 

While the Rays are currently gaining ground on their AL opponents due to the continuation of a stellar run from their bullpen, there are three teams in the NL that are receiving similarly inspired work this month: the Giants (whose press corps has been bemoaning the pen as a weak link since Opening Day); the Cubs (using their bullpen as a primary way to stay in the see-saw race in the NL Central); and the Brewers, who've been waiting for a highly touted relief corps to snap back into shape in order to hold off the Cubs and the now-fading Cardinals.

Injuries are likely to dominate the ultimate outcome of 2021's embattled baseball season, as opposed to the so-called "new steroids" that are hardly the cause (and barely the symptom) of baseball's ongoing hiccup. A saving grace of such uncertainty is that there appear to be no behemoth aggregations lumbering around in either league in '21--no '17 Astros, '18 Red Sox, or '20 Dodgers--a fact that might keep several seemingly unlikely contenders in the chase all the way into the homestretch, an occurrence that would help redeem at least some of what continues to plague a game that has been modeled, Moneyballed, and moralized into the fetal position over a five-year span of ignominy. It is little comfort that baseball has been matched during this by a nation gorging itself on distortion, innuendo, and arrogant self-loathing. As Adam Marsland so eloquently sang, what the world (and baseball) needs now is a good deus ex machina. As we await such an unpredictable prospect, let's say to one another what Bacall said to Bogie in Dark Passage: "Close your eyes, and cross your fingers."