And, miracle of miracles, it's one of the so-called "precepts" that's been a bedrock formation in the sabermetric ideology for a long, long time--since before the fellas who wrote The Book spent an exhaustive (and, frankly, exhausting) fifty pages on just about everything than anyone could possibly think about concerning the topic.
Oh, yes, what topic is that, you ask? Well, jeez Louise, it's in the title of this essay...it's the strategic play that everyone from Linear Weights to Win Shares to Those Who Bash Managers For A Living™ can agree to despise: the sacrifice hit.
The disdain for the bunt that first surfaced in The Hidden Game of Baseball nearly thirty years ago is so ingrained that more than a few eyebrows were arched when The Book boys picked over its carcass at a dirge-like pace and found a few mitigating situations in which a bunt might not call for the formation of a lynch mob.
 |
| Gene Mauch--the king of the sac hit (142 SH in 1979) contemplates the religious efficacy of vestal virgins... |
And what is most surprising--beyond that, in fact...one can easily call it downright shocking--is that this won-loss record is so good.
More than good, in fact.
Since 1954, teams who have employed one or more sacrifice hits in an individual game have posted a winning percentage of .641 (46,522-26,064) in those games.
This figure has been declining over time (for reasons that may well be worth exploring in a separate study). Teams in the 50s had a .671 WPCT (3565-1748) when they utilized the bunt, while so far in the 2010s that WPCT has decayed to .614 (2212-1390).
Still, this is quite a fact. Despite the math that indicates a great deal of counter-productiveness strategically in the SH, using it in games co-exists with an elevated WPCT.
Does this mean that everyone should start bunting with promiscuous impunity (as some folk already seem to believe is the case)? Of course not. But it points up the fact that Win Expectancy Tables and all of the other doodads applied by the math set are only as good as the actual context that applies to the strategy in question.
One of the other surprising facts that a look at the games in which sacrifice hits occur is that they feature higher runs scored totals than average. The average number of runs scored by the teams who employ at least one sacrifice bunt in a game is 4.91. That's about half a run higher than the historical average.
The overall batting line for teams in these games: .275/.337/.414 (.751 OPS). Which, again, is higher than baseball's batting line since 1954: .259/.323/.397 (.720 OPS).
These facts might lead you to the particular context--or, more accurately, the nuance within that context--which explains why a strategy that's so reviled is associated with such a high WPCT. The secret is to look at the distribution of sacrifice hits with respect to the relative score in the game in which they occur.
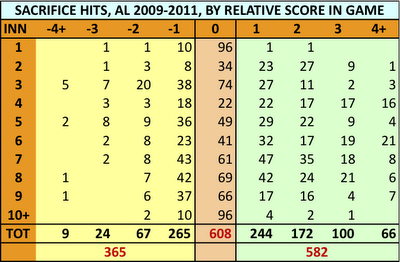
To look at this, we compiled SH data from three years (2009-11) in the American League (the two leagues sharply diverged in SH/G as a result of the introduction of the DH; the AL has a less skewed distribution of SH as a result). What we found explained why the WPCT is so high.
Looking at the chart, you can see that there are many more sacrifice hits that occur when the team is ahead in the game than when they are behind. Interestingly, when we leave out the SH that occur when the game is tied (about two-fifths of the total in the 2009-11 AL), those that are implemented while the team is ahead is just under 62% (61.7 to be exact). That lines up awfully well with the overall WPCT in games where SH occur.
This suggests that, despite their retrograde status in terms of win expectancy, SH are essentially neutral game elements due to the specialized context in which they tend to occur. There are only three places in the chart above at right where teams use SH more when behind than ahead: the first inning, the third inning, and in extra innings.
So we can see that SH are "wired" for success by the fact that so many more of them are called for when the team is ahead than behind. (That's yet another surprising discovery.) And we can see that much of their lack of "grand strategic" value (as measured by win expectancy) is mitigated by the specific game context in which they get employed.
So the late Gene Mauch, roundly castigated by Bill James in his Guide to Managers book for setting the modern record in SH (142 in 1979), can rest easy. He could point to the fact that his team went 56-32 in those games--and that he called for twice as many SH when the Twins were ahead than when they were behind.
And so we can conclude that the SH is not really the out-of-control eyesore for the game of baseball that it is so often represented as being. Most managers actually manage to employ it in a way that optimizes its outcome in terms of wins and losses. And there simply aren't so many of them to induce the type of mouth-foam that so often accompanies a so-called "empirical" approach to one of baseball's "knotty problems." The inconvenient truth about sacrifice hits is that the insurance runs they create tend to stand up, and the judicious use of the strategy is nowhere close to being a sufficient reason to form a posse.

