Sunday, February 27, 2022

ALPHA ALPHA: TWO RELATED (BUT UNRELATED) CHARTS

How much overlap would you expect from leader lists that cover the semi-related concepts of on-base percentage (OBP) and bases-on-balls percentage (BBP)? Semi-related is probably the right term here: you can have a high (if not stratospheric) OBP without a lot of walks, if your BA is high enough. And you can fail to register on an OBP list of .350 or higher and still have a lot of walks, if your BA is low enough.

It's one more testament to how the game has changed in the century since the introduction of the lively ball that our first "outlier scenario" above was mostly clustered in the 1920s-1930s, and the second such scenario is building to a peak since the bottom dropped out of the offensive explosion in 2009.

But let's not dwell on that--particularly with so much strife around us at the moment--a senseless, reprehensible war in the Ukraine, and a stupid, cynical "war" perpetrated by the baseball owners. (And then there's the great retreat from WAR evinced by the neo-sabes, who've finally signaled that the construct they've been trying to cram down people's throats for the past twenty-five years is not ready for the real world...assuming, of course, that a "real world" still actually exists.)

OK, that was a bit more "dwelling" than we'd suggested, but so it goes. Before seeing our latest "alpha" charts for OBP and BBP, ask yourself: how many players will be in the "leaders" sections for both? We have twenty-four letters with enough data to produce substantive leaders lists--will we average the equivalent of one match per letter? Let's find out.

Here is the chart for OBP...remember, players in red type are Hall of Famers. And remember as well that this list includes only players with at least 5000 lifetime plate appearances...
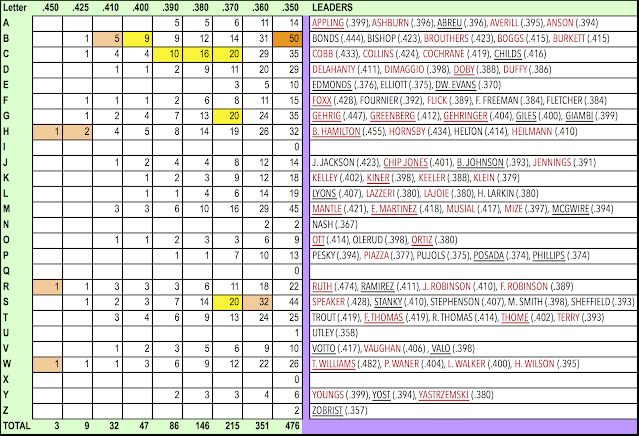


Note that there are 50 players in the leaders list for this chart who are in the Hall of Fame. That doesn't correlate exactly with the players who have a .400+ OBP; several of those guys (Todd Helton, Manny Ramirez, Mike Trout, Joey Votto) are either still active or are still on the HOF ballot. And there are a few .400+ OBP guys who are never going to get in for one reason or another (Max Bishop, Joe Jackson, Billy Nash, Eddie Stanky, Riggs Stephenson, Roy Thomas).

Now let's look at the players who walk a lot. Here's the distribution of BBP by percentage of plate appearances (BB/PA) and the accompanying leaders list:
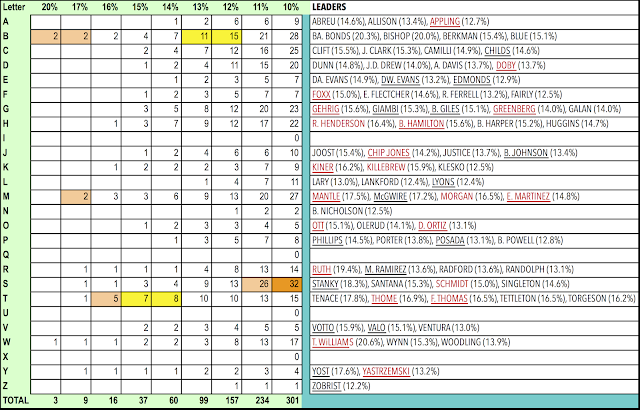


So how many players are on both leaders lists? Count up the number of players whose names are underlined. The answer is 28. So it's a reasonably robust overlap.

But...how many of these high-BBP players shown in the above chart are also in the HOF? Remember that the high-OBP guys numbered 50. 

It turns out that there are only 21 high-BBP players on this leader list in the Hall of Fame. Of course, we're missing some folks, because the leaders list is not comprehensive. If we define a high-BBP player as someone who walks at least 12% of the time, that produces a list of 35 high-BBP players with plaques in Cooperstown.

Which is still way below the number of high-OBP players in the Hall. 

The conclusion is clear: walking remains an unsung skill. While it is clearly not as significant as getting on-base via other means (particularly the extra-base hit), it is much more difficult to walk your way into Cooperstown. 

And it's become almost impossible to do in the time frame after the game expanded. The only player with low power totals and high walks to make it into the Hall of Fame in the past sixty years is...

Wade Boggs.

A game where such an offensive combination is possible for more than one player in sixty years is a much better version of the game than what we have today. Baseball needs to address this--but...

...see our third paragraph above. 

And the beatdown goes on. (Sigh.)

[EDIT: Note that some of this is indeed simply structural to the game...the distribution totals for the two charts confirm this. Note that it's half again as easy for 5000+ PA career players to achieve an OBP of at least .350 than it is for them to walk at least 10% of the time. Players like Boggs have always been infrequent; but it's imperative that they don't become extinct.]

Monday, February 7, 2022

"ALPHA ACTUARIALS" FOR...STOLEN BASES!

Homer-happy folks be sad again, and be it ever so beatific that we have lots of other categories to examine in what our high-falutin' PR department wants us to call the "alpha actuarials"--and we be humoring them while they're still Zooming us, but as soon as that screen goes dark...

...POW!

Actuarially speaking, though, stolen bases by age for the leading guys on the table that will (eventually) make an appearance here would be interesting to look at, fitting in with some of the "speed score" studies Bill James did before his insurance policy lapsed and his dependents lost their shot at that "double indemnity" clause... (and you be wondering just how long I can prolong this pseudo-patois before I have to bite the bullet and fork over the numbers, right?) Right, as is "so right to be left on the doorstep craving taters when the man be giving me three-week old collard greens"...goddam you, Malcolm, I got enough fiber in my diet already... (some unintelligible swear words here: fill in your favorites or pick one from column A, two from column B, three from...)

...OK, OK!


Let's look at the levels of exclusiveness here...168 players have stolen 300 or more bases in their careers over the 151-year span of MLB (1871-2021), but only 18 have stolen 600 or more bases; 75 players have stolen 400 or more bases, but 364 have stolen 200 or more bases.

The alpha leaders are more displaced in time than is usually the case, so we've tracked it in the added column at the right edge of the table (called L's LY to give you the "leader's last year")--where you can see that 11 of the 26 letters have leaders whose careers ended during the years after expansion, while 12 of the teams have leaders whose careers ended in the Deadball Era or earlier.

Rickey Henderson and the original Billy Hamilton (beware of cheap imitations, y'all...) get the H's off to a rousing start, but they peter out rather quickly after that. The M's have the most players with 100+ steals in their careers, but because the C's have a lot of guys with 500+ SBs in their career compared to everyone else, they actually have the most total SBs among their players with 100+ steals, with a total of 20,446 to the M's 19,928. 

And as is usually the case with these types of breakouts, X does not mark the spot.

Finally, one really must love a list that has Walt Wilmot on it. Walt appears to have been overpaid by the Chicago White Stockings during a large portion of his career (did he have "daguerreotypes" of the execrable Cap Anson in compromising positions? Did the aging Anson have enough flexibility left to even get into a compromising position?) but he is the holder of three insanely obscure records. Walt is the only player to be hit by a batted ball twice in the same game; he's the only player to steal eight bases over two consecutive games (Rickey H. only managed seven in two games); and he was the first player ever to walk six times in a game (the only other guy to do it: Jimmie Foxx...who was, of course, a compromising position unto himself).

Of course, it's really a shame that he didn't do all these things in the same game, but there are limits to what even a guy named Walt Wilmot is capable doing. (Apparently.)

...and we might never get to those home runs, chillun!

Saturday, February 5, 2022

STILL ANCHORED TO 3RD BASE: TRIPLES BY AGE

And here you probably thought that we were going to "go JoePo" and produce our own version of "tater alphabet soup," now, didn't you? We will do so....eventually.

Face it--we all need to get our minds off HRs. They have been toxic in nature for almost a quarter of a century now, thanks to the backlash against the McGwire-Sosa extravaganza of 1998-99. And yet they've become even more inescapable: talk about "American carnage."

As we quoted from Bill James' Twitter poll taken back in November 2020 (back when "fraud" was just a legal term and not the fever dream of fascist wannabes...), folks would rather see a triple in a ball game than a home run. (As a certain man possessed of surreal syntax once said: "You could look it up.") We need more than a few good men (and women, for that matter...) in this country; but we need even more triples.

So we're sticking with the three-bagger (which is not the new size of peanuts that might not be available at ballparks until the lockout turns into Rob Manfred's one-way ticket back to law practice). Whether hit by an eighteen year old Phil Cavarretta, or a forty-two year old Honus Wagner, the triple is the most exciting event involving a batted ball that can occur on a baseball diamond. 

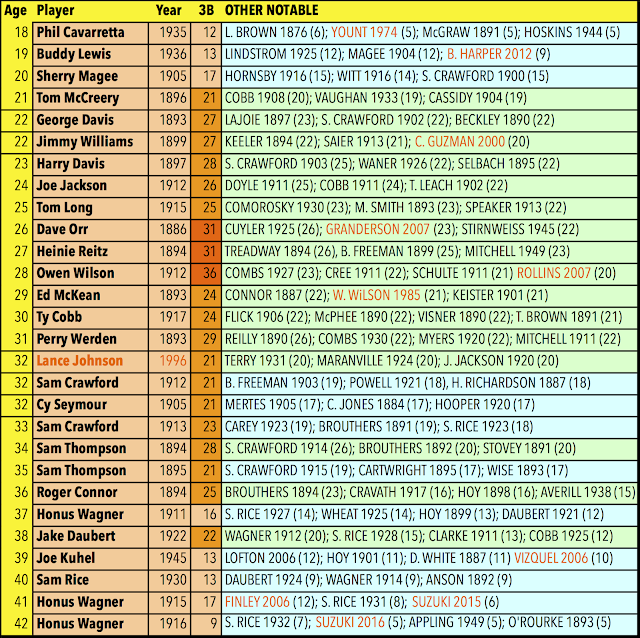
And so we're going to shift the focus from "alpha soup" to the tossed salad of age. Who hit the most triples at age 18? Well, we just told you. Age 42? Ditto. But there are twenty-three ages of man (or, rather, ballplayer) left to anatomize...and so we will. Here. Right now:


As you can see, the age leader in triples undergoes a rise and fall that follows a most systematic pattern analogous to the theories of "peak age performance" for batters: the age-year in which the most triples were hit is 28 (tied in with the major league record of 36 triples in a season, as achieved back in 1912 (one hundred ten years ago...) by Owen "Chief" Wilson.

The rise and fall of the triples leader by age would have a shape roughly reminiscent of a bell curve--though its manifestation as the primary nineteenth-century instrument of power would produce a kind of sawtooth effect in the mid-to-late 30s.

We've shown the leader and those hitters who were next in line for each age-year in question. By combining the leader with "those next in line," we can then see who appears on the triples-by-age leader list the most often. And we don't think you'll be surprised to discover that all-time triples leader Sam Crawford appears on the list in either capacity seven times--which is not too far off from the total number of times that hitters from post-expansion times show up collectively (there are eleven such instances; only one of which--age-32 Lance Johnson in 1996--was actually the leader).

Of the 28 age-leaders (the number is higher than the actual 25-year age range due to a couple of ties, one of which is a three-way tie...), eleven are from the nineteenth century, and another eleven are from the Deadball era. There are two instances where the leader repeats as leader in the next age-year: Sam Thompson (the power-hitting triples masher) in 1894/1895 at ages 34-35; and Honus Wagner, in 1915/1916 at ages 41-42. Wagner and Jake Daubert have probably the most impressive feats amongst triples hitters, with their totals of 17 and 22 triples respectively, both past the age of 35. 

The takeaway: we really, really need another guy like Sam Crawford again. And we need some ballparks to be realigned in order for someone to have a chance to be Sam Crawford. 

And we need it sooner than later, because it is later than you think...

Friday, February 4, 2022

A TRIPLE SIP FROM THE "ALPHA" SOUP BOWL...

We enter the "lost zone" of hitting when we turn our attention to the triple, increasingly orphaned as baseball continues to devolve into a variant of Home Run Derby.

(The old--and we do mean old--TV series that faced off a series of early 60s sluggers, such as the somewhat unlikely duel here between the immortal Willie Mays and the journeyman Jim Lemon, has turned out to be all-too-prescient in showing us the way to the last five years, the Age of Launched Juice--or is that Juiced Launch? It likely matters not...)

Of course, there was a time in baseball when triples were the most significant measure of power for a hitter. That period, which began at the dawn of the game and managed to continue for a few precious years after the advent of Babe Ruth, has produced a subset of Hall of Fame players who continue to move farther away from the average with every game played. (Even as the opposite, of course, is happening with the home run.)

But enough acidulous past-as-prologue, already. You're here to see another spiffy chart, and who can blame you? So sans ado (adieu?), here are triples as rendered via (avec?) "alphabet soup"...


Just as there used to be only one hitter with 700+ HRs, there still is only one man (Sam Crawford) with 300+ triples. And it is likely to stay that way until (or unless) Hell freezes over. 

As is now the custom for our displays, we show you the names of players who are not in the Hall of Fame in red ink. Which leads to the question--who is the hitter with the most triples who is not enshrined in Cooperstown?

The answer: Ed Konetchy, with 182 triples and in need of a ticket to enter through the front door at the Hall. Hot on his heels is Harry Stovey, with 176, and with a list of statistical accomplishments beyond his robust triples totals strongly suggesting that he deserves enshrinement. Then there's Tommy Leach (172), a third baseman-outfielder for the Pittsburgh Pirates during their early powerhouse days in the 1900-12 time frame, who batted at or near the top of the lineup and was a notch or two above journeyman.

And then there's Joe Jackson (169)--who would doubtless have gone over the 200 mark save for a certain obscure incident.

He's followed by Sherry Magee (166), with a Hall of Fame case about as strong as Stovey; Jake Daubert (165), who hit 22 triples at the age of 38, the most ever at that age (beating out Honus Wagner); Bill Dahlen (163), maybe the most deserving 19th-century player not yet in the Hall; Mike Tiernan (162), whose career petered out dramatically after reaching the age of 30; and George Van Haltren (161), one of the late nineteenth century's best leadoff men. Finally, there's Jimmy Ryan (158), another fine outfielder in the 1880s-90s who might deserve a plaque in Cooperstown for feuding with the execrable Cap Anson.

And in case you were wondering, we left the Babe off the list, in hopes that some of you would wonder where he was...since he hit 136 triples in his career (a total that certainly could provoke disbelief).

We will let you discover the players closer to own time who are on this list...

Thursday, February 3, 2022

NEW LETTERS IN THE "ALPHA SOUP": DOUBLES

We continue "up the food chain" with our alphabetical leaderboard displays. This one gives you a singular view of the two base hit:


As before, the names in red ink represent the players who are not in Hall of Fame.

Some "combinatoric" stats: 

1) There are no players with 700+ doubles and 500+ HRs.  

2) There are only four players with 600+ doubles and 500+ HRs: Hank Aaron, Barry Bonds, David Ortiz and Albert Pujols

3) Two of those players--Aaron and Bonds--have 500-599 doubles and 700+ HRs; they are joined on this list by Babe Ruth

4) Players with 500-599 doubles and 600-700 HRs: Alex Rodriguez, Willie Mays, and Ken Griffey Jr.

5) Players with 500-599 doubles and 500-599 HRs: Ted Williams, Manny Ramirez, Frank Robinson, Miguel Cabrera, Rafael Palmeiro, and Eddie Murray. (Cabrera is just 3 doubles away from joining the 600/500 group.)

Looking at the leaders, the names that stick out the most in terms of doubles are: Adrian Beltre (632), Todd Helton (592), Bobby Abreu (574), and Jeff Kent (560). Helton was helped by his career-long tenure at Coors Field; Beltre, Abreu and Kent moved around, and had a good bit less help from their home parks. Beltre is an odds-on choice for induction on the first ballot. 

Long-time readers know that we remain high on Kent as a Hall of Fame candidate, and his achievement in doubles is just one more reason why he belongs in Cooperstown. 

But it looks like we'll need another of those damned "committees" to pull that off. 

Tuesday, February 1, 2022

MORE "ALPHA SOUP": SINGLES GOING STEADY...

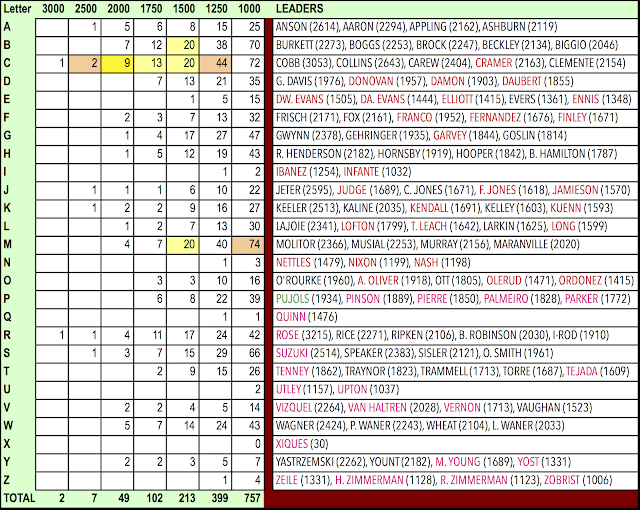
As promised (threatened?), more charts with various stats broken out by the first letter of a player's surname. We stick with our "retro" stance for a bit longer and focus on singles--a stat that rarely gets broken out by itself.


If you are cross-walking between posts, you'll note that the number of players with 1000+ singles in their career is a bit more than half of the number who have 1000+ hits. And if you aren't cross-eyed or color blind, you'll note that we inadvertently shifted the shade of red in the middle of the table where we were designating the players on the singles leader boards who are not in the Hall of Fame.

It would seem that getting two thousand singles is a good bet for making it into the Hall, however; only two players with such a quantity of one base hits (Doc Cramer and George Van Haltren) are on the outside looking in at Cooperstown. (There's also Ichiro Suzuki, but we're figuring that he'll make into the Hall at some point in the next decade.)

Of course, the man with the most singles--Pete Rose--is also MIA for the HOF. 

As is usual, the B's, C's, M's and S's are the most populous letters.

Doubles coming next...stay tuned.

Monday, January 31, 2022

HITS BY THE ALPHABET: BEYOND THE "BIG FLY" MENTALITY...


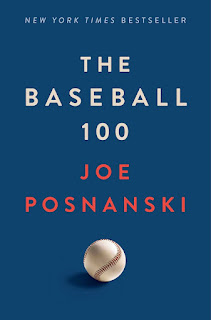
It's been a banner year for Joe P. and his BASEBALL's 100, but it is not an achievement that captures everything about the game that one needs to know. It's strong on the Negro Leagues, and speaks to our ongoing need to acknowledge baseball's prior racial transgressions. It's strong on nostalgia, which leads to a strange view of history when it is allowed to be wallowed in for its own sake (which is the bedrock skill of Joe P., whose writing so often slips into a "hushed" mode at a point when it should cut through the "fathers and sons having a catch" modality). 

But it is weak on the game's present set of crises, which have accelerated to a point where virtually every long-term fan is expressing grave concerns in a rising preponderance of their own public discourse. It's also weak on nineteenth-century baseball, based on what appear to be two parallel judgments: first, Joe's friend Bill James has, in his ever-expanding dotage, become more and more derisive about early baseball, dismissing it as not being a "major league" at all; second, the segregation that was built into the game in those formative years is now an easy target, permitting it to be swept aside even while the first forty-seven years of the twentieth century that continued those reprehensible practices are granted various dispensations.

In the spirit of keeping alive the version of baseball that was exempt from the tendency toward "homer-itis", it's worth pointing out that Joe P.'s instinctive reaction to having access to "alphabetical data" (specifically, the breaking out of statistical leaderboards by the first letter of a ballplayer's surname) was to examine--you guessed it--home runs. There are three other kinds of hits that occur in baseball, but apparently those aren't worth examining. Only the "big fly" seems to matter. (With apologies, of course, to our friend and occasional operative Buzzy the Fly, who has survived the protestations of many a "Sultan of Swat.")

So let's issue a corrective to the mentality that drives Joe P. and his ilk away from the type of game with open outfields and "room to run," where speed is at least as important as power--a game where everything gets counted. Let's start with the cumulative expression of offense: let's look at the leaders in hits, and let's embrace the full-scale spirit of fun that Joe meant to convey but pushed aside to show the bias of the age he (and the rest of us) live in.

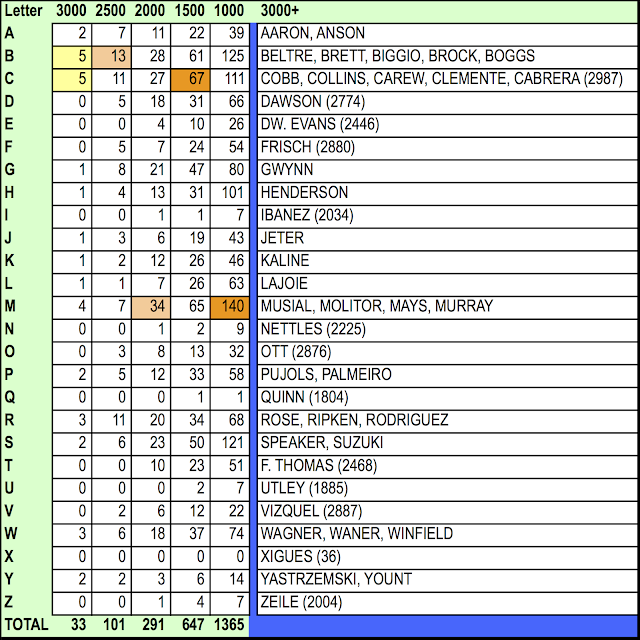
Here, a summary chart displaying how many hitters there are with 3000, 2500, 2000, 1500, and 1000 lifetime hits, with the 3000-hit players (or the leaders, when there are no 3000-hit players) by letter of the alphabet: 

We've provided a bit more info than Joe P. did with HRs (though he spent more time on individual players than we will--less fetishistic that way, you know) in that you now know--in case you hadn't spent the last three weeks counting this up by hand--that there are currently 1365 players in baseball history (yes, even the nineteenth century) who've made 1000 or more hits during their career.

You also know the numbers for the increments as they increase by 500, all the way up to 3000. 

And you have the names of the leaders for the letters of the alphabet, including Leovigildo Xigues, whose 36 hits now count in the official major league register thanks to changes that, to his credit, Joe P. advocated. "X" now marks a spot that is no longer empty...

Note that it's the B's, C's, M's and S's that do much of the heavy lifting, though we were surprised to see "H" make it into fifth place. Is anyone else surprised to see the paucity of surnames starting with N? 

And we'll leave it you (or Joe P.) to determine how many of the 3000+-hit club listed here also hit 500+ HRs. Suffice it to say that it's a small subset of the list.

This type of list is fun--and we need fun. We also need to spread fun around to encompass as many things we can bring under its spell--which in this case means expanding our horizons to acknowledge that this list is just as informative and "fun" as a similar list for home runs. 

We'll be back with more of these while Buzzy waits his chance to cover the "labor negotiations" for us. Stay tuned...

Friday, December 31, 2021

A FOLLOWUP ON STARTING PITCHER USAGE

Three weeks ago we showed you numbers that demonstrated the escalating decline of starting pitchers' in-game innings pitched (in particular, the decline of 6+ IP outings). We promised to provide some more details on that--and we race the ball coming down in Times Square heralding a new year where the prospects of an interrupted season are as high as they've been in more than a quarter-century. (Talk about dropping the ball...)

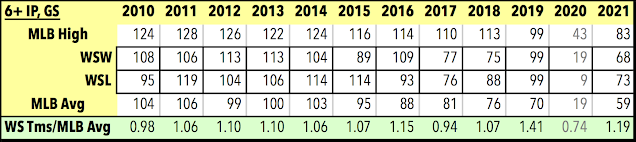
Anyway, here's a chart that doesn't give you all of the team data (too all over the map over the period covered to provide a succinct, coherent pattern) but focuses on the top end--both in terms of the greatest number of 6+ IP games over the 2010-21 time frame, and in terms of the teams with the most success (defined here as the teams that made it into the World Series).

The patterns that emerge here are as follows: the teams with the highest number of 6+ IP starts are still reasonably robust (83 in 2021, despite the pronounced desire on most managers' part to be extra careful with starting pitcher workload), and that World Series teams have had a mostly consistent pattern of exceeding the MLB average for this stat by 12% over the past twelve years (nine of twelve years, and e should probably throw out 2020 due to the "very special" nature of that "season").

We won't post all the data, but when we look at the 30 MLB teams in 2021, the sixteen with winning records averaged 66 games where the starter went 6+ IP; the fourteen teams with losing records averaged 51 such games. So you can conclude that better pitchers still get a chance to go longer into games. Some of that could be that their best games get them into the seventh inning before they go too deeply into the "third time through" the batting order; or we might conclude (or, at least, surmise) that managers are not yet as slavish about that concept as certain fellow travelers of the Tango Love Pie™. 

If baseball manages to play a full season in '22, we expect the 6+ IP numbers to go up, possibly back to levels seen in 2018-19. We'll monitor that--if the labor situation permits. Stay tuned...

Wednesday, December 8, 2021

WHAT THE NUMBERS SAY ABOUT RECENT STARTING PITCHER USAGE...

You've heard quite a lot about how starting pitching is akin to a endangered species, what with terms such as "opener" and "bullpen days" being bandied about over the past few years. 

Of course, "starting pitching" can never disappear from baseball, no matter how embattled those individuals may be, since a baseball game simply has to have someone take the mound in the first inning. (Unless they abolish the first inning, of course--and let's not give Rob Manfred any more cockamamie ideas: he already has enough for several lifetimes.)

But clearly something is happening to starting pitching--or, at least to starting pitchers--thanks to more of that "neo-sabermetric innovation" that has produced a series of distorted strategies via a cascade of domino effects that would have made John Foster Dulles a happy camper. 

Our task here: to document the recent changes in starting pitcher performance as manifested by a simple measure--the number of innings they are allowed to throw in any given game. We present data from the 2010-19 decade, along with the same numbers for 2020 and 2021.


This is the time frame in which the complete game went the way of the dodo bird, so you'll note that we lump games started (GS) into a catch-all category where the starter goes six or more innings. When we follow that number across the time frame, we notice that the total has dropped from being nearly two-thirds of all games down to just over one-third of all games.

You'll note that these tendencies, as measured in all of the breakouts shown above, are distorted by the pandemic-plagued 2020 season, which imposed extreme variants of "pitcher ecology" into the mix. In 2021, there is bounce-back in the "6+ IP GS" data, and it is enough of a recovery that we might expect it to continue in 2022 despite the widespread application of "two times through the batting order" stricture that is strangling discourse of late. 

Note that the percentage of pitchers getting into but not completing the sixth inning (as shown in the row summarizing the "5-5.67 IP GS) has seen a more incremental rise over the period.

One figure we probably should've put into the chart is the sum of the top rows, to show how many starting pitchers still make it into the sixth inning, since it's a measure that shows more of what the true impact of such strategic behavior produces. That number doesn't dip below 80% until 2016 (79%), but in the "thrust-counterthrust" of the launch-angle explosion in 2017-19 drops down to 71% in 2019. In 2020 starters were coddled due to the uncertainties that existed due to the long layoff between spring training and the start of the season, resulting in a drop below 60%, which in 2021 snapped back up to 66%.

And, finally, the new "trend" where the "two times through" mantra has asserted itself: games where the starter goes less than five innings. This is broken out in additional detail to separate games where the pitcher is ineffective (giving up 3 or more earned runs in the outing) with those where the pitcher is most likely being removed in lockstep with the "two times through" dictum.

The data shows that short starts have more than doubled since 2010, but that it didn't start to become a noticeable "two times through" phenomenon until 2018, when it began to be employed in response to the launch-angle explosion. That number spiked in 2020 and has resulted in the terminology associated with the practice becoming almost unbearably ubiquitous. It may be good news that those numbers subsided in 2021, but the numbers are still much higher than they were, even in 2017-18.

Shorter and ineffective starts have increased incrementally since 2010, but it's easy for us to forget that run scoring levels in 2010-15 dipped down to levels often well below 4.5 runs/game, which seems to be baseball's unspoken Maginot line (witness the widespread squawking about "anemic offense" early in the 2021 season when run scoring was under 4.5 runs/game, albeit accompanied with startlingly low batting averages). 

Overall, the use of short but effective starts has tripled since 2010, with the number really going through the roof in 2019 (in what must have been a response to the most egregious point in the launch-angle explosion). 

We'll want to track the <5 IP starts in '22 (assuming, of course, that there actually is a '22 season: Manfred and his merry band of robber barons are hard at work following their mentor Dulles with a "brinksmanship" variant of labor negotiations that is apparently a plutocrat's wet dream) as that will tell us if an increase in starting pitcher effectiveness will drive down the knee-jerk application of the "two times through" mantra. 

A bit later we'll return to this data, looking at it at the team level, to see if this approach is confined to a few teams, or if it actually is as widespread as the media folks would have you believe. Stay tuned...