Friday, December 31, 2021

A FOLLOWUP ON STARTING PITCHER USAGE

Three weeks ago we showed you numbers that demonstrated the escalating decline of starting pitchers' in-game innings pitched (in particular, the decline of 6+ IP outings). We promised to provide some more details on that--and we race the ball coming down in Times Square heralding a new year where the prospects of an interrupted season are as high as they've been in more than a quarter-century. (Talk about dropping the ball...)

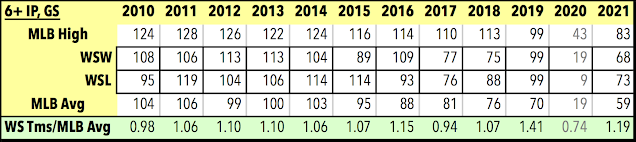
Anyway, here's a chart that doesn't give you all of the team data (too all over the map over the period covered to provide a succinct, coherent pattern) but focuses on the top end--both in terms of the greatest number of 6+ IP games over the 2010-21 time frame, and in terms of the teams with the most success (defined here as the teams that made it into the World Series).

The patterns that emerge here are as follows: the teams with the highest number of 6+ IP starts are still reasonably robust (83 in 2021, despite the pronounced desire on most managers' part to be extra careful with starting pitcher workload), and that World Series teams have had a mostly consistent pattern of exceeding the MLB average for this stat by 12% over the past twelve years (nine of twelve years, and e should probably throw out 2020 due to the "very special" nature of that "season").

We won't post all the data, but when we look at the 30 MLB teams in 2021, the sixteen with winning records averaged 66 games where the starter went 6+ IP; the fourteen teams with losing records averaged 51 such games. So you can conclude that better pitchers still get a chance to go longer into games. Some of that could be that their best games get them into the seventh inning before they go too deeply into the "third time through" the batting order; or we might conclude (or, at least, surmise) that managers are not yet as slavish about that concept as certain fellow travelers of the Tango Love Pie™. 

If baseball manages to play a full season in '22, we expect the 6+ IP numbers to go up, possibly back to levels seen in 2018-19. We'll monitor that--if the labor situation permits. Stay tuned...

Wednesday, December 8, 2021

WHAT THE NUMBERS SAY ABOUT RECENT STARTING PITCHER USAGE...

You've heard quite a lot about how starting pitching is akin to a endangered species, what with terms such as "opener" and "bullpen days" being bandied about over the past few years. 

Of course, "starting pitching" can never disappear from baseball, no matter how embattled those individuals may be, since a baseball game simply has to have someone take the mound in the first inning. (Unless they abolish the first inning, of course--and let's not give Rob Manfred any more cockamamie ideas: he already has enough for several lifetimes.)

But clearly something is happening to starting pitching--or, at least to starting pitchers--thanks to more of that "neo-sabermetric innovation" that has produced a series of distorted strategies via a cascade of domino effects that would have made John Foster Dulles a happy camper. 

Our task here: to document the recent changes in starting pitcher performance as manifested by a simple measure--the number of innings they are allowed to throw in any given game. We present data from the 2010-19 decade, along with the same numbers for 2020 and 2021.


This is the time frame in which the complete game went the way of the dodo bird, so you'll note that we lump games started (GS) into a catch-all category where the starter goes six or more innings. When we follow that number across the time frame, we notice that the total has dropped from being nearly two-thirds of all games down to just over one-third of all games.

You'll note that these tendencies, as measured in all of the breakouts shown above, are distorted by the pandemic-plagued 2020 season, which imposed extreme variants of "pitcher ecology" into the mix. In 2021, there is bounce-back in the "6+ IP GS" data, and it is enough of a recovery that we might expect it to continue in 2022 despite the widespread application of "two times through the batting order" stricture that is strangling discourse of late. 

Note that the percentage of pitchers getting into but not completing the sixth inning (as shown in the row summarizing the "5-5.67 IP GS) has seen a more incremental rise over the period.

One figure we probably should've put into the chart is the sum of the top rows, to show how many starting pitchers still make it into the sixth inning, since it's a measure that shows more of what the true impact of such strategic behavior produces. That number doesn't dip below 80% until 2016 (79%), but in the "thrust-counterthrust" of the launch-angle explosion in 2017-19 drops down to 71% in 2019. In 2020 starters were coddled due to the uncertainties that existed due to the long layoff between spring training and the start of the season, resulting in a drop below 60%, which in 2021 snapped back up to 66%.

And, finally, the new "trend" where the "two times through" mantra has asserted itself: games where the starter goes less than five innings. This is broken out in additional detail to separate games where the pitcher is ineffective (giving up 3 or more earned runs in the outing) with those where the pitcher is most likely being removed in lockstep with the "two times through" dictum.

The data shows that short starts have more than doubled since 2010, but that it didn't start to become a noticeable "two times through" phenomenon until 2018, when it began to be employed in response to the launch-angle explosion. That number spiked in 2020 and has resulted in the terminology associated with the practice becoming almost unbearably ubiquitous. It may be good news that those numbers subsided in 2021, but the numbers are still much higher than they were, even in 2017-18.

Shorter and ineffective starts have increased incrementally since 2010, but it's easy for us to forget that run scoring levels in 2010-15 dipped down to levels often well below 4.5 runs/game, which seems to be baseball's unspoken Maginot line (witness the widespread squawking about "anemic offense" early in the 2021 season when run scoring was under 4.5 runs/game, albeit accompanied with startlingly low batting averages). 

Overall, the use of short but effective starts has tripled since 2010, with the number really going through the roof in 2019 (in what must have been a response to the most egregious point in the launch-angle explosion). 

We'll want to track the <5 IP starts in '22 (assuming, of course, that there actually is a '22 season: Manfred and his merry band of robber barons are hard at work following their mentor Dulles with a "brinksmanship" variant of labor negotiations that is apparently a plutocrat's wet dream) as that will tell us if an increase in starting pitcher effectiveness will drive down the knee-jerk application of the "two times through" mantra. 

A bit later we'll return to this data, looking at it at the team level, to see if this approach is confined to a few teams, or if it actually is as widespread as the media folks would have you believe. Stay tuned...

Tuesday, December 7, 2021

THE HOF & DICK: SCREWED AGAIN

Breathtaking hypocrisy & CYA (hint: this is not the acronym for the Cy Young Award...) commingled this past weekend when the kluged-up committees assembled to "rectify" long-standing oversights and voting errors in baseball's Hall of Fame--and gave their shabbiest performance to date. 

The committee once again left Dick Allen hanging, one vote shy of admission. It smacks of a set-up, just as the postponement of the vote in 2020 when Dick was losing his fight with cancer robbed him of being inducted while still alive.

Meanwhile, the committees selected four other men of color (Buck O'Neil, Bud Fowler, Minnie Minoso, Tony Oliva) as a massive form of overkill to deflect from their real message--which is that "uppity" folk will continue to be punished until "morale improves."

Meanwhile, the giddy Joe P., finally able to stop his ceaseless proselytizing for O'Neil (a fabulous ambassador for the Negro Leagues elevated to stardom by his performance on Ken Burns' documentary, but middling as both a player and a manager), suggested that the committee elected Oliva and Jim Kaat because they wanted to "elect people who were alive."

You see the problem with that statement, right? If the committee had met in 2020--which they easily could have done virtually, as everyone else in the world has been doing since the early months of the pandemic--they could have elected Dick Allen while he was still alive.

Of course, Dick probably would have fallen one vote shy at that point, too.

Minoso received an excess number of votes compared to the other candidates, which suggests that there was some hanky-panky in the back room.

Jayson Stark handled the ongoing situation vis-a-vis Dick with kid gloves at The Athletic: it's a useful read, because it points up just how bad things are in the "committee world" of the Hall of Fame. Oliva and Gil Hodges were elected with less than 2,000 career hits (just like Dick), and with significantly lower league-relative stats. Their election opens a Pandora's box of ersatz candidates that will further plague the process as it goes forward.

Hodges is a sentimental favorite here, but that is mostly due to his stewardship of the 1969 Mets. The Hall of Fame needs a place for managers who preside over miracles: Hodges should join Fielder Jones and George Stallings as part of a wing created to celebrate the great upsets in baseball history. These feats are dismissed in a hyper-cynical age, but they are an integral part of the lore of the game. 

Hodges shows up well in a performance comparison of first baseman during the span of his career, particularly from 1948-59, but it was also a time of transition at that position.

Elsewhere in the committee's assault on basic logic: why Kaat and not Tommy John? John has the human element in his favor--recovering from what was previously a career-ending injury to come within shouting distance of 300 wins. The procedure pioneered by Dr. Frank Jobe is not called "Jim Kaat surgery." 

Kaat has fewer wins than John, and a lower league-relative ERA (108 to 111). Arguments can be made to include or exclude both, but not one in lieu of the other

Meanwhile, the Socratic Gadfly reminds us that the early years committee, with its conveniently nebulous portfolio, went CYA with Fowler and O'Neil while once again snubbing Bill Dahlen (at or very near the top of nineteenth-century shortstops) and Bob Caruthers (in the "age of Ohtani," a peak candidate of breathtaking short-term accomplishment on the mound and at home plate).

(Note that the last player from the nineteenth-century major leagues to be enshrined in Cooperstown is Bid McPhee, who was waved in the side door back in 2000.)

It's inarguable that Fowler was among the very first victims of racial discrimination in organized baseball. That incontrovertible certainty outstrips our incomplete knowledge of his on-field prowess.

But the fact that two African-Americans were selected as part of a PR blitzkrieg undertaken by MLB to deflect from its ongoing woes while the rest of nineteenth-century baseball is summarily ignored tells us that "history" is being cynically stage-managed by the "powers that be."

The stench continues, and has at least another five years to waft ignominiously in the air until these committees are reconvened. Frank Frisch, much vilified by Bill James (even as he reached his lowest moment with his execrable, borderline libelous commentary about Dick) can now peer out from his casket and smirk at how "history" is repeating itself. 

So much stench, and so much blighted eternity...

[UPDATE 12/12]: Joe P. has again attempted to have his cake and eat it too in his recent blog post about the Hall of Fame, where he suggests that it was "liberating" for Buck, Gil, Minnie and Tony to be inducted. The question is: "liberating" for whom? We're all happy as f*ck for you, Joe: you got what you wanted--but at what cost to so many others? Many now await endless campaigns for the Steve Garveys of the world, with little logical recourse to prevent the roster of inductees from tripling over time as the folks who run the Cooperstown boondoggle will be sorely tempted to allow such a process to accelerate, all in the name of bringing more fans (and $$) into their picturesque little neck of the woods. Joe, as always, fails to see the real ramifications of what is likely a Rubicon event: that this is a "ca-ching" moment, not an "ah-ha" moment.]

Monday, November 8, 2021

WORLD SERIES HOME RUNS: THE FOLLOW-UP

We promised you some additional data pertinent to World Series HRs; lo and behold, we're actually following through on that promise...

First, the table with overview information. As you'll see, the 2022 World Series will definitely produce the 1000th WS HR. (We haven't looked yet to see how many HRs have been hit in the pre-World Series post-season since 1969, but it's got to be a good bit past 1000 at this point...we may follow up on that during the off-season at some point.) 

A key column in the data is marked %WT HR...that's the one giving you the percentage of total HRs hit by the winning team in each WS. The grand total shows that winning teams have hit 55% of the HRs that have occurred in the WS, with the HR/G per team average now settling in at .72 (...if you're calculating at home, remember to multiply that G total by 2 in your equation to get homers per game per team).

As you'd probably expect, that average HR/G total has been rising over time, as the various time slices indicate.

Next we have the opposite table from what we showed you in the last post. Here are the teams who were out-homered the most in the World Series and still managed to win. Oldsters are not going to be surprised to discover the 1960 Pirates on this list, setting a "WS homer deficit" record (-6) that stood until the Angels knocked off the Giants in 2002 despite a deficit score of -7.

Such a scenario has remained viable in the twenty-first century, as you'll see by noting the fact that four of the seven teams with the greatest negative differential are post-1999 teams. Of course, 2015 was a more different brand of baseball than what we've experienced over the past five years.

Having seen this list, you may be wondering just how monolithic the HR differential is in helping to determine the WS winner. We have a nifty little chart that summarizes all of those differentials in terms of the WS winners and answers that question for you.

Read this chart from left-to-right in the top row from 9 to 1 (these are the absolute values for the HR differentials. This row shows all the teams that won with a positive HR differential--marked WT (+). Then read right-to-left on the bottom row to see the number of teams that won the WS with a negative HR differential--marked WT (-).

The totals for each row tell you how many times teams with positive & negative differentials won the WS. That 61-to-33 looks very decisive...but we need to include those WS where the differential was zero. As noted in the far right column, that figure is 23. (For completists, the years in which teams hit the same number of HRs in the WS are as follows: 1905, 1906, 1907, 1909, 1912, 1918, 1921, 1923, 1926, 1934, 1943, 1948, 1971, 1974, 1981, 1985, 1990, 1991, 2000, 2001, 2007, 2018 and 2019.)

So your half-empty/half-full perspective on this aspect of WS performance hinges on where you attach those zero differential games. Do you say "teams that hit at least the same number of HRs as their opponents in the WS win the series 72% of the time" (84/117), or do you say that "teams that outhomer their opponent in the WS win the series 52% of the time" (61/117)?

We'll let you decide. Note, however, that WS teams who outhomer their opponents by three or more HRs have won nearly three times as many WS as the teams who are outhomered by their opponents by three or more HRs (35 to 12). 47 of the 117 WS fall into that category, or 40%; that means that the HR differential range from 0-2 accounts for 60% of the WS (70 of 117). 

With that, you are free to go gentle into that dying of the light known as the off-season. 

--Or not...

Thursday, November 4, 2021

IF YOU'RE THINKING THAT SOMETHING WAS LOPSIDED...

 ...in the World Series you just saw (or, for that matter, boycotted)--

You'd be absolutely right.

The Atlanta Braves tied a record for the greatest differential in HRs hit in the World Series by the series winner as they wrapped up the '21 Fall Classic with three more round-trippers in their 7-0 Game Six win.

As the table at left tells you, the Braves outhomered the Houston Astros 11-2 over the six games, making for a differential of +9 for the winning World Series team.

The only other time that a winning WS team hit nine more HRs than the losing team was back in 1956, when the Yankees hit 12 HRs in their 7-game win over the Brooklyn Dodgers, who hit only 3 HRs.

If you go by percentage of HRs hit in World Series--perhaps the ultimate stat pertaining to "home run dominance"--then the Braves come in fourth, with 85% of the total homers hit in the '21 World Series. The 1939 Yankees hit all seven of the HRs hit in the World Series that year, pushing past the record they'd set in 1928, when they'd hit nine of the ten HRs hit. (The Philadelphia A's hit 86% of the HRs hit in the 1929 World Series, rounding out the trio of winning WS teams with a higher percentage of the total HRs hit than the '21 Braves.)

Hard to say which was more impressive--the number of HRs that the Braves hit, or the number of HRs that they allowed to the Astros, who were no slouches in long ball department during the regular season (221 in '21).

We'll come back with some additional data about home runs in the World Series in a subsequent post.

Thursday, October 28, 2021

WILL 2021 PRODUCE A BORING 7-GAME WORLD SERIES?

Two games into the World Series, and even the mainstream media (Andy McCullough at The Athletic) is tumbling to the possibility that this year's clash between the Braves and the Astros might not produce any "stellar games" even as it appears that the two teams might fight it out all the way to Game Seven.

"Stellar games" is a proxy for games that are decided by one run. Of course, there can be memorable games that don't wind up in that category: walk-off homers with men on base are still exciting, even if the winning team's margin is greater than a single tally. But we still use the one-run game as the benchmark for a particular type of ambient, lingering tension that keeps the outcome in doubt until the last pitch.

It seems paradoxical that a post-season series that goes to its limit (five or seven games) might not be all that riveting despite a "win-or-go-home" finale, but it does occasionally happen. Of course, it could all turn around for the Braves and Astros over the weekend, and nailbiting games could come into play; but we have two rather lackluster games in the book thus far, which creates the possibility for a peculiar form of boredom.

To get a closer look at this phenomenon, we did what we always do: we created a table filled with data. There have been exactly forty World Series that have gone all the way to seven games (leaving out those few years when the Fall Classic was expanded to a best-of-nine), and we've captured the run differentials in all 281 games (yes, 281: there was a tie game in 1912 that forced a "Game Eight"--that one we've included.

So here they are, and they've been sorted in a way that creates an admittedly crude quantification of "an excitement index" for each of the forty 7-game series. (Some may wish to call it "the boredom index": we salute you by raising our half-empty wine glass.)

As noted, it's simplistic. We capture the number of games where the contest is decided by one run, and the number of games where the contest is decided by four or more runs. We record that info, we place it side-by-side, and we subtract the number of 4+ run differential games from the 1-run differential games. 

That gives us a value (in the column at the far right of the table called "DDIF") that suggests (as opposed to insisting) a range of excitement based on the relative abundance of one-run games.

When we sort by DDIF, we make our suggestion into a crude assertion--and we now assert that the 1972 World Series between the Oakland A's and the Cincinnati Reds, which featured six games decided by one run and one blowout (Game 6, decided by seven runs) is the "most exciting" World Series of all.

Now, of course, you don't really remember that series, do you? You may remember the 1991 World Series between the Twins and the Braves, which featured five one-run games, including two such games in Games 6 and 7 (which is a nuance that might need to be incorporated into a method such as this).

Or you are perhaps even more likely to remember the 1975 World Series, which had two blowouts but five one-run games, including that epic 12-inning Game 6, followed by a nail-biting Game 7. 

So we can posit that World Series that go seven games seem more exciting if the final games are close (read: one-run games). Thus the 1971 World Series, with its closing one-run contests in Game 6 and 7, is another one that's memorable for this dynamic. It joins 1924, 1975 and 1991 as the only seven-game series to end with two one-run games.

On the other end of the spectrum, we have the Fall Classic where there are no one-run games. In a nice touch of symmetry, there are four such World Series: 1931, 1965, 1968, and 1987. Of these series, it's 1965 that has the most blowout games: six. (Only the low-scoring Game 7, a 2-0 final where Sandy Koufax pitched a shutout on two days' rest, escaped the peculiar lack of tension within the games as they played out in a see-saw pattern; 2 wins for the Twins, 3 for the Dodgers, 1 for the Twins, 1 for the Dodgers. So the outcomes of the games can produce some tension as to who will win, but that doesn't ensure that the individual games will be particularly exciting.)

Examining some of the patterns here, particularly in terms of the 7-game series that started with two blowouts (which the 2021 WS has joined, with its 4 and 5 run differentials), shows us that the only hope that we have for a result that winds up high on the DDIF sort would be for the next five games to be one-run games. Of course, that has never happened--no one has closed out a 7-game WS in that way. Only one Series--that unheralded one held in 1972--has ever had five consecutive one-run games (the A's and Reds did that in Games 1-5 of that series).

No one else has had four in a row. But there are a number of three one-run games in a row incidences: though you can pick them out on the chart (we bolded the one-run games), we'll give you the full list: 1991 (G 2-4); 1975 (G 2-4); 2001 (G 3-5); 1947 (G 3-5). We've never had a G 5-7 sequence in which the games were all one-run outcomes. (The closest: the 1952 WS, where the Dodgers and Yankees had one-run games in G 5 & 6 and a two-run outcome in G 7.)

Now that would be a nice way to relieve the boredom, right? Let's suggest that our teams get busy and give us something new under the sun to close out this topsy-turvy year. 

Thursday, October 14, 2021

THE TWO TEAMS THAT PLAYED EACH OTHER THE MOST IN A SINGLE SEASON...

 ...will not be the 2021 Giants and Dodgers, despite what will turn out to be an even two dozen games that they've played against each other this year. 

That total ties the number of games played between the Dodgers and the Braves (still in Milwaukee) in 1959, where the two teams played 24 times (including a two-game playoff). But it's not the all-time record for most games played by two teams in a single season. That total (including post-season play) is 26--held by the Yankees and Red Sox, who did this in 2003 and 2004 thanks to two seven-game Championship Series.

But what about the most games played by two teams in a regular season? Clearly we wouldn't be writing any of this if it simply turned out to be those 1959 Dodgers and Braves. (The Dodgers, by the way, won 14 of the 24 contests played between those two teams that year.)

Have you got it? Yes, it happened exactly 70 years ago--1951, to be exact--when the Dodgers and Giants played 25 games against each other: 22 as regularly scheduled, and three more in a playoff series memorable for Bobby Thomson's walk-off home run.

That game capped an incredible comeback run by the Giants, who'd been 13 games behind the Dodgers as late as August 11, 1951--and who were still six games back as late as September 14th, at which point they won 11 of their next 12 games to wind up in a tie.

But the story of the Giants-Dodgers head-to-head competition in 1951 is as riveting and unusual as the playoff series itself. We examine some aspects of those 25 games in what follows.

First, the Giants got off to a terrible start in 1951, in large part due to losing their first five meetings with the Dodgers. At that point in the season they were 2-12 and nursing an eleven-game losing streak. (The Giants had blown leads in each of their three games vs. the Dodgers at the Polo Grounds on April 20-22, and lost two more at Ebbets Field before getting off the schneid thanks to a six-run first inning against two forgotten Dodgers--Chris Van Cuyk and Earl Mossor--en route to a 8-5 win.)

They would not win another game in Ebbets Field until September.

In late June, the Giants had turned around their season and entered a three-game series with the Dodgers at the Polo Grounds only 5 1/2 games behind the Dodgers. This series was an odd premonition of what would occur at the end of the year, with a similar "rubber game" on June 28th that the Giants won 5-4 thanks to a three-run homer--by Monte Irvin, however, not Bobby Thomson, which turned around the score in the bottom of the eighth, not the ninth. Consider it a practice run for what would happen three months later...

However, the Giants then proceeded to get their hats handed to them six times in a row at Ebbets Field--in a three game series on July 4-5 (including a doubleheader sweep on the 4th) and again on August 8-9 (including another doubleheader sweep on the 8th, made especially frustrating in the second game of that twin bill, where the Giants had rallied from a four-run deficit in the late innings only to lose in the tenth inning). In the game on the 9th, they'd blow a 5-3 lead and wind up losing 6-5 despite drawing a total of 15 walks in the game--and having Whitey Lockman thrown out at home trying to score the tying run in the top of the 9th.

At that point the Giants' record against the Dodgers overall was 3-12, and 1-8 in Ebbets Field. After that bitter 6-5 loss, they were 12 1/2 games out. Two days later it would reach 13, at which point the Giants would embark on a sixteen-game winning streak, including a sweep of the Dodgers at the Polo Grounds in three tightly contested games, won by the Giants by scores of 4-2, 3-1, and 2-1 (that last one being a memorable duel between Sal Maglie and Don Newcombe, with what proved to be the winning run coming on a Newcombe wild pitch).

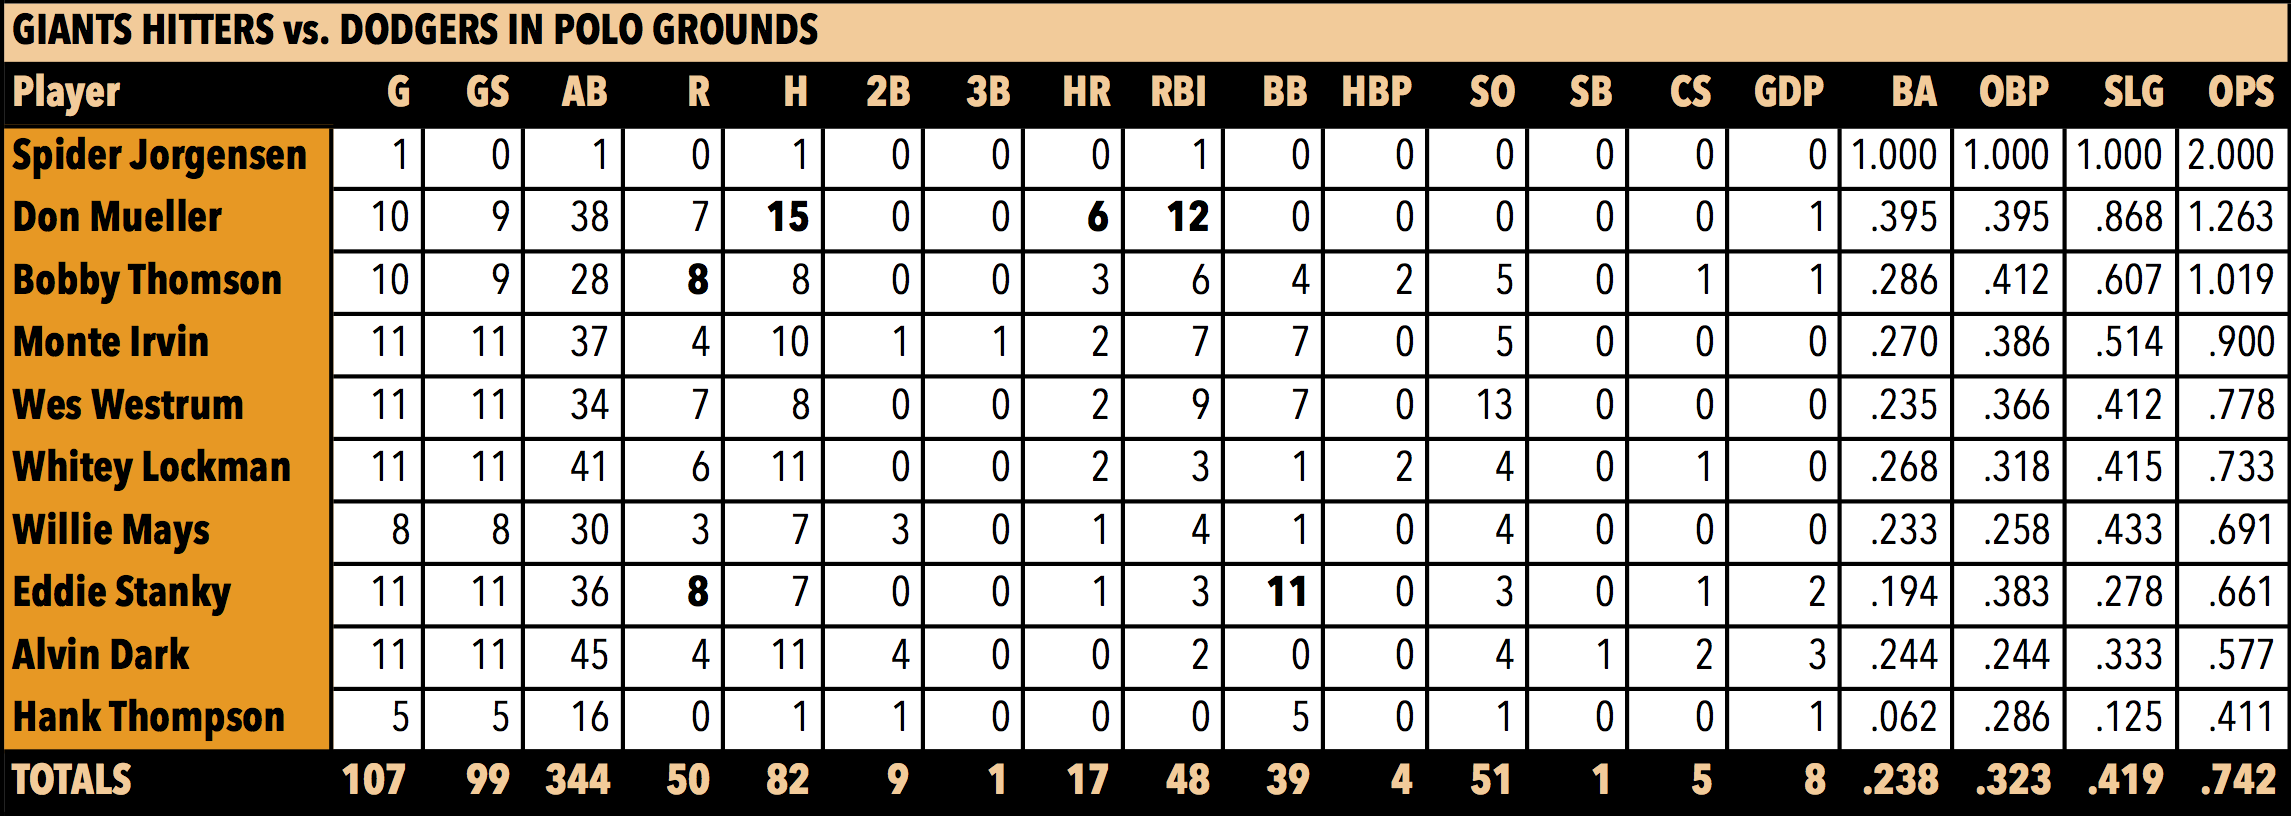
At the beginning of September the Dodgers returned to the Polo Grounds for a two-game series and were routed each game (8-1 and 11-2), led by the unlikeliest player ever to hit five homers in two games: Giants right fielder Don Mueller, who hit three in the first game and two in the second. The Giants were now suddenly just five games back.

A week later the Giants were back at Ebbets Field, where they (of course) lost, a 9-0 rout, with Newcombe shutting them out on just two hits. The next day, September 9th, was pivotal, however: Irvin hit a two-run homer off Ralph Branca in the fourth, and Maglie made it stand up, scattering eight hits and four walks in a 2-1 win that was sealed by a game-ending double play with the tying run on third base. Without this win, the Giants would've come up short despite their 12-1 season-closing drive.

Going into the playoffs, the Dodgers had won the season series 13-9 thanks to that 9-2 cushion at home. They'd suffer an uncharacteristic loss in Game 155 when Irvin and Thomson hit homers off Branca and Jim Hearn allowed only a second-inning homer to Andy Pafko--sounds like a 2021 game, doesn't it--and the Giants scored a precious third win at Ebbets, 3-1. The Dodgers drubbed the Giants 10-0 in the second game behind Clem Labine in the first of two at the Polo Grounds. (The second game you may dimly remember due to its containing what is still called The Shot Heard Round The World.)

Not a catch-22, but a catch-24...
The head-to-head breakouts of hitting stats in for the two teams, separated into performance totals at each ballpark (excluding the three playoff games), show that the Dodgers were tigers (Tigers?) at the plate in Ebbets vs. the Giants that year, hitting 21 HRs in eleven games and combining for a .306 team average (that includes the pitchers, whose stats aren't shown). The Giants, led by the unlikely long-ball assault from Mueller, hit 17 HRs at the Polo Grounds; more crucially, their pitchers limited the Dodgers to a .206 team batting average, which helped them to win seven of the eleven regularly scheduled contests in '51.

Twenty-year old rookie Willie Mays was not a major presence in these games, though that would change soon enough: after hitting just .197 in all 19 games (including the three playoff games) against the Dodgers in '51, he'd return from the Army in 1954 to club 10 HRs in 22 games against Brooklyn, hitting .378 as the Giants turned around their season series with the Dodgers, going 13-9 against their crosstown rivals en route to a five-game cushion in the pennant race. And there was something about a catch, too--not a catch-22, though, just a catch--you might have heard of it...
Monday, October 4, 2021

POST-MORTEMS FOR OUR "MINUTIAE"...

We'll look at baseball's 2021 run scoring patterns in a post later in the month, but for now let's wrap up several of the "minutiae" that we've presented intermittently over the season.

The M's win! (the Pythagorean lottery only...so sorry!) Hell, a team whose Pythagorean won-loss record works out 76-86 has no real chance of lighting up the post-season, so the Mariners' shot at entering the playoffs would've been a fluke anyway. As it turned out, the 2021 M's are officially the luckiest team ever, having won 14 more games than Daddy Pythag says should be the case.

That does leave the question of what team that made it all the way to the World Series had the most Pythagorean luck. Of course, we have the answer to that and a bit more: here are the eleven (11 as in seven-eleven, for those of you who blow your dough blowing on dice...) luckiest teams to play in the Fall Classic. As you can see in the column at the far right of the table, seven of the eleven teams were defeated by their less-lucky opponents.

This year's luckiest playoff team? After a long stretch with the Red Sox in the lead, it turns out to be the Yankees (+6.46, for those of you who crave extra precision). Next: the Cardinals (+5.27), then the Giants (+4.13) before we get to the Red Sox (+3.55).

More interesting, perhaps, are the playoff teams (or near-and-yet-so-far teams) at the other end of the luck spectrum. The White Sox (-4.36), the Astros  (-5.68) and the Braves (-6.02) all played a good bit under their Pythagorean projections. The biggest underachievers, however, were the Blue Jays (-7.82), who projected to win 99 games but came up one win short of a post-season tumble.

Austin Adams quietly hits...the road. After setting a record (of sorts) with by completing a "double Dunkin" run of 24 HBPs, the burly Padres reliever found himself collecting splinters down the stretch as San Diego collapsed in September (7-21). Do not be surprised if Adams is elsewhere in 2022...

The fate of those "fat pitchers"... We will spend more downtime in the off-season refining our search for all the "chunky chukkers" in MLB, since there is clearly a "coverage gap" in this all-important area. (We need to keep tabs on all the guys with "gut hang"...)

Of the two showcased at the end of July, lefty Nestor Cortes Jr. had the more successful run, becoming a steady member of the Yankees rotation down the stretch. In 12 starts from July 28 to the end of the year, Cortes fashioned a 3.31 ERA, with the Yanks going 8-4 in those games. He struggled a bit with the HR ball, but who didn't in 2021?

His righty counterpart Paolo Espino was not so successful for the depleted Nationals, but they gamely kept him in the rotation despite a poor August (7.36 ERA) and he perked up a bit in September. It's another story of dogged perseverance for Paolo--the only man named Paolo to play in the big leagues--he finally stuck for a full season in the majors at the age of 34. Never overpowering even when young, Paolo will probably remain in the majors for a couple more years because he demonstrated versatility (pitching better in relief before being thrust into the rotation), but he probably won't get another such stretch as a starting pitcher (snif!).

The "smallfry" renaissance fizzles a bit: So the short folk did not, in fact, create an oasis of tiny excellence as we'd hoped might be the case previously. Cedric Mullins' slump in September dropped his OPS+ down to 135, pushing him off our list of tiny 140+ achievers. The man who managed to make it for the smallfry is Jose Ramirez of the Indians (probably the last time we'll use that embattled nickname in the semi-present tense...) who had a fine year (36 HRs, .536 SLG) and posted a 141 OPS+.

Other well-known smallfry final OPS+ numbers are as follows: Mookie Betts 128 (injury-prone season), Jose Altuve 127 (31 HRs), and--in ~440 PA, a surprising, unsung season from the A's Tony Kemp (5'6", 160 lbs.) at 126, easily the best year of his career. All in all, it was a solid showing from the little big men, but it fell short of what we'd been hoping for back in July.

The 50+-HR-a-month club grows a bit more: That total moved upward again in '21, as five teams clustered up over that line in September (we'll cover the "hot" month a bit later when we return to MLB run scoring levels/patterns...), bringing the all-time total of 50+ HRs-in-a-month incidences to 90. The 60+-HR-a-month club moved up to three all-time when the Blue Jays slammed 66 in September, placing them second all time behind that insane Yankees performance in August 2019 (74).

Sunday, September 26, 2021

OF LUCK AND LATITUDE

We were reminded that the 2021 Seattle Mariners are poised to be one of those "backward" teams that occasionally surface out of the smooth surface of common sense, baseball division. With just a handful of games left in the season, the M's were assured a winning record despite scoring fewer runs than their opponents.

And, according to the Pythagorean Won-Loss projection (a tool Bill James developed before he signed on with the Red Sox and slowly deconstructed his toolbox), it's not just one of those wispy, "just over the line" type of things--where they go 82-80 and score ten fewer runs than the opposition. As of the other day, the M's "luck" number (as opposed to their "lucky" number) was 13--according to Pythagoras (last seen with a ball and chain as opposed to a bat and ball) the M's have won 13 more games than they "should" have based on their runs scored/runs allowed ratio.

So we thought it would be of interest to determine just how extreme this divergence actually is. Are the M's in the top fifty of teams who've defied gravity in this manner? Fortunately, the folks at Forman et fils (you know them as Baseball Reference dot com) have continued to compile this data, thus permitting us to refresh our memory.

Which definitely needed refreshing, because as it turns out the M's are close to making baseball history. The chart of the "luckiest" teams (actual wins minus "Pythagorean wins" = "extra wins via luck") shown at left indicates that the M's are #2 in the entire history of the game with respect to "luck." (And stop the presses: the M's 14-1 loss to the Angels last night has currently pushed them ahead of the 1905 Detroit Tigers in this category...if you are willing to believe that wins, whether real or theoretical, can be measured using numerals on the right side of the decimal point.)

If one stops to think about it, you won't be surprised to discover a number of pennant-winning/post-season teams showing up on this list. The 1905 Tigers represent the recessive counter-trend, a bad team lifted into mediocrity via good fortune. But of the twenty-four teams since 1901 whose "luck" has rounded up to a total of at least ten extra wins over a season, a total of nine have been post-season teams--most recently (and most spectacularly) the 2016 Texas Rangers, who won 95 games despite scoring only eight more runs than their opponents that year. 

The M's aren't going to make the post-season this year, but they just might end up with the all-time "lucky" number, which is at least a kind of consolation prize. But another look at the chart reveals that the M's 2018 team also ranks extremely high in this rarified corner of the baseball world: the 2018 team ranks eighth all-time in terms of "luck,", with an LQ ("luck quotient") of 11.56  And the 2000 edition of the M's is in 22nd place at 9.83. Is there something about the weather patterns in that latitude region that clusters these events in such a way that one franchise would reach the top echelon of this list three times within twelve years? Look the list over, and you'll find no other team with more than two appearances on it.

So what is the likeliest reason for this "luck"? Most of the teams here had very good to outstanding records in one-run games. In fact, the 2016 Rangers hold the all-time record for highest WPCT in one-run games (.766, or 36-11). The 2012 Orioles were the former holder of this record (29-9, or .763), breaking a record that had been held for over a hundred years by the 1908 Pittsburgh Pirates (33-12, .733). 

Following up on the teams listed here will provide the baseball wanderer with a series of intriguing reasons why/how these teams managed to overachieve. Sometimes it's a vulturing bullpen, with more wins in relief; sometimes it's an unusually lucky record in extra-inning games. Whatever it is, it's almost never reproducible: the closest we can find in the database are those two D-back teams, each with LQs over 11 within two years of each other.

We'll look at "unluck" sometime during the post-season, and provide an update as to whether the '21 M's set the record for baseball's luckiest team. Stay tuned...