Sunday, September 7, 2014

THE SHADOW OF YOUR GIFT BASKET...


It's Derek Jeter Day in the Bronx, and there's no truth to the rumor that slightly more than 8,000 seats had to be reserved for the ladies who have passed through his portals--er, life.

The once-mighty Yankees are looking for some version of the infamous Jeter "gift basket" here in the waning days of 2014, flailing to acquire something that resembles their September magic of yore. It's been clear for the last month that such an elixir, or talisman (or "proof-of-purchase" coupons, the post-modernist answer to the "box top"...) is unlikely to emerge from their 40-year old captain.

The decline of the Bombers has paralleled the momentum in the aging process as it has affected Jeter, whose "last hurrah" season in 2012 was spoiled by a severe post-season injury that has robbed him of his uniquely crisp offensive skills. What Jeter has proven thus far in 2014 is that the Yankees can give up more runs than they score--just as they did in 2013 without him. (The Yanks haven't done that since 1992, when they completed a four-year run of sub-.500 seasons.)

Jeter beat the odds back in 2011, coming back from a foot injury and the doom-laden prognostications of Nate Silver (in a moment he should have heeded, as it's become increasingly clear that the "wunderkind of electorality" would be better off if he and his posse would stick to politics...) to hit .340 down the stretch, and follow up the next year with his last "Jeter season" at the plate. But it was soon all too clear that he was not going to do the same in 2014, even with two off-seasons to recover from his broken ankle.

The splits data shows what's happened, and it's more than stark. Derek has lost his ability to dominate lefties. This is a guy whose lifetime OPS against LHPs is .893, a little more than a hundred points better than when he's facing RHP. His lifetime SLG against lefties is .492. This year, it's .296.

Over the years, Jeter has had a slight but measurable home-field advantage (.833 OPS at home, .803 on the road.) This year, that's gone. His OPS at Yankee Stadium in 2014: .543. He has not hit a home run at home this year.

Likewise, Derek has always been a very dangerous hitter when he was ahead in the count (.345 BA, 1.006 OPS). He looked just like himself in 2012 (.383 BA, 1.030 OPS). This year? .217 BA, .595 OPS.

High leverage situations? Lifetime: .310 BA, .810 OPS. 2014: .202 BA, .532 OPS.

Another odd fact in the splits that you might not associate with Jeter--he's been markedly weaker hitting against relievers in his career (OPS vs. SP: .852; OPS vs. RP: .744). As you'd suspect, that pattern has continued in 2014. Spectacularly so. Jeter is hitting .184 against relievers this year. With an OPS of .478.

That's not a misprint. The Yanks would be better off batting Brendan Ryan (insert obligatory "for Crissakes" here...) against relief pitchers. Or Stephen Drew. But, in a climate that apparently demands reverence above and beyond the call of duty, not only can manager Joe Girardi (in every other way doing a fine job, keeping a crumbled/crinkled ragtag group of has-beens and whosis on the fringes of the playoff race without his two top starting pitchers...) NOT drop Jeter from the #2 slot, he can't bat for him. As Richard Carpenter sang--and does anyone remember that Richard could actually sing??--it's a "marvelous charade."

As noted, it's the climate. The "Jeter climate" has been increasingly contentious, as the usual Midwestern suspects have gotten their collective hackles up about East Coast media bias and its willful ignorance with respect to Jeter's fielding skills. The grumbles started in earnest when Jeter gunned down [EDIT: or should that be "flipped out"?] the hapless Jeremy Giambi in the 2001 playoffs, and that led Joe P. to develop his own patois mauvais in a pathetic attempt to gain access to the New Yorker crowd. Much of the Yankee-hating crowd, both within the media bubble and in the boob-tubeified boondocks, came running to join in the din of disdain.

Which made us wonder if we could track all that, as a kind of meta-valedictory sendoff to the dickhead who has launched a hundred thousand screeds. Just how the forces of "yea" and "nay" fared over the years where polarization between the foul poles was just as prevalent (and just as invidious) as it was in the halls of Congress?

Over the past couple of weeks we've had C.O. Jones feed copious quantities of flavored rice crackers to our favored feverish researcher, Fergus McFollicle, who's been busy quantifying the "love" and "hate" as it radiates around the Gift Basket King. (All this, and droning background quotes from the works of Empedocles--a guy who, unlike Joe P. and his ilk, knew when to take the strategic swan-dive into the volcano.)

Fergus courageously immersed himself in every freakin' piece of verbiage either spoken or written about the man who has a dead man announce him, and, as we suspected, the backlash began in 2002. (The two different versions of our "Jeter's gift basket" chart show the relative volume of commentary and the "love/hate" percentages over the ensuing years.)

As you can see from the percentage chart, things leveled off a bit when the Red Sox found post-season success. But when Jeter's 2009 season threatened to bring him an MVP award, the negative trend was put back into overdrive. As the volume chart depicts, things were relatively quiet (and blissfully so) in 2013, while most of what folks had to worry about pertained to just how many cheeseburgers Derek was consuming during rehab.

The positive commentary, doubtless peaking due to the protracted "farewell tour," has gone up sharply in 2014. And it's clearly benefitted from the parallel tour being conducted by Budzilla, a junket whose travel arrangements should have specified a Chinese junk with training wheels.

Ultimately, the only percentage that's going to matter in 2020 is 75%--what Jeter will need to be inducted into the Hall of Fame. You can read it here first: he's going to score in the 90s. If it's higher than 95, there will be grumbling.

[UPDATE: it's the bottom of the ninth in the Bronx. Mr. Gift Basket has an infield single and a walk in four PAs, but the Yankees have been unable to rise to the occasion against the Royals and Yordano Ventura, and they trail, 2-0, in the top of the ninth.]

Thursday, September 4, 2014

2014: COMPLETE GAMES #92, #93, #94, #95, #96, #97, #98...

We are closing in on the century mark for CGs now, as a little flurry of them that featured journeymen and youngsters...which leads us to a quick investigation of pitcher age with respect to CGs.

But before we do that (as we simultaneously escape the foul odors of a farting dachshund...), let's call the roll of those who joined the 2014 CG rolls:

--Scott Feldman (#92, 8/30), a three-hit shutout over the Rangers in a 2-0 Astros win.

--Jeff Samardzjia (#93, 8/30), becoming the twentieth pitcher to have "LP" assigned to their CG in 2014, allowing only four hits and two runs over eight innings in a 2-0 loss to the Angels (part of the A's "meltdown weekend" in Anaheim).

--Clay Buchholz (#94, 8/31), adding another Buddah-brow wrinkle to a confounding season, with a three-hit shutout of the Rays (final score: Boston 3, Tampa Bay 0).

--Danny Salazar (#95, 9/3), pitching a good bit better for Cleveland after his return from a two-month demotion to AAA, scattering eight hits as the Tribe beat Detroit, 7-0.

--Miguel Gonzalez (#96, 9/3), a key target of FIP-meister eye-rolling (his ERA is exceeding his FIP at near-record levels...), defying the odds with a four-hit shutout of the Reds in a 6-0 win for the Orioles.

--Tyler Matzek (#97, 9/5), turning things around in his rookie season for the Rockies, surviving a six-game stretch from 7/29-8/25 where his ERA was 6.75, throwing a three-hit shutout in Coors Field, the first complete game tossed there by a Rockies starter in three years.

--Corey Kluber (#98, 9/6), continuing his breakout season in which he's become the Cleveland ace, with his third CG of 2014, a five-hitter as the Indians beat the White Sox, 5-1.

Now to the age thang. Early in the season we noted that younger pitchers were showing up on the CG list in quantities that would be worrisome if CGs weren't so rare. (Still, the cautionary tale is worth at least an allusion, if not a re-tell: on the April list in our chart of 2014 CGs by age, among the four CGs by 23-year-olds is Martin Perez, who threw two of them--and by mid-May was under the knife.)

The question that we might try to answer is whether there's an early-and-late pattern in terms of CGs by young(er) pitchers. Given the query limitations that are in place at Forman et fils, however, that means creating such charts for each individual season, so that project will need to wait a bit....clearly we need at least fifteen years' worth of data to have anything to say about this.

What we can do now is look at the percentages of CGs by age range for the past fifteen years (2000-14). The 2014 chart shows you where our age range breakpoints are: -25 is Age Range 1; 26-29 is Age Range 2; 30-34 is Age Range 3; and 35+ is Age Range 4.

That chart (% of CGs by Age Range from 2000-14) can be seen at left. The numbers bounce around a good bit from year to year, as small samples often will, but the general picture comes into view reasonably well when we look at the data over somewhat longer stretches of time.

Five years seems to be enough to establish the reigning trend, which is that the largest plurality of CGs come from pitchers in their so-called "prime years" (AG 2, ages 26-29), with just under 40%. AG 1--the youngsters--and AG 3--the veterans--each account for about a fourth of the CGs, with the oldsters--AG 4--accounting for the remaining one-tenth.

What we're curious to see, however, is whether CGs for the youngest group tend to cluster at either end of the season. It would make sense at the end of the year, when roster limits are expanded, for there to be a "prospect effect," where younger pitchers are given a shot (particularly by teams who are out of contention).

And it's also possible that something similar is at work in April (and possibly May), where young guys are given more of an opportunity to "prove themselves" by "going all the way"--which leads us to that burning question posed by Frank Zappa: "Would you go all the way for the USA?"

Well...wouldya???

Monday, September 1, 2014

2014: SLOW DRIP's FINAL LEAK: INTERLEAGUE PLAY, SEPTEMBER

Hard to fathom, but we are already gearing up for the big wind-down, as a particularly wan baseball season (and another year of feckless, flung-to-the-margins interleague play) trudges towards its conclusion.

The AL wound up winning 26 of 49 interleague contests staged in August, but the ongoing news (not that anyone else will report this to you, of course...) is that the prevailing "random schedule bias"--now there's one that our alternate sponsor, the Euphemism for Euthanasia Foundation, can get behind--is still operating vis-a-vis interleague play.

NL teams still wind up playing more .500+ clubs from the AL than vice-versa: over the past five years, they've played 24% more such games than the AL. They have also managed to get trounced in these games, managing only a .415 WPCT from 2010-14. (That's worse than the historical average for teams playing  vs. .500+ teams, which is .437.)

In terms of interleague play results and potential impact on the final 2014 standings, there's only one team that looks to be a pronounced beneficiary--the Royals, who completed their interleague schedule with a bang during August by winning seven of eight games, finishing 15-5 for the year. At the moment, that means that the Great Powder Blue Hope is only three games over .500 against its own league.

The Royals have been interleague road warriors this season (8-2, which ranks tenth all-time for road performance for teams with nine or more road games during a single season of interleague play). Drawing most of their road games against the doormats of the NL West (Padres, D-backs, Rockies) didn't exactly hurt their chances.

Attendance in interleague games has held steady with the 2013 average, but the September 2014 schedule looks noticeably softer than what proved to be the case "match-up"-wise for these contests. That last week, with two series where the teams are playing out the string, looks ripe for the "not with a bang but a whimper" scenario. (The good news: neither of the weakest interleague road draws--the Marlins and the Padres, both well under 25,000 per game--are in the mix. The bad news: the Red Sox, who are the second best interleague road draw at just under 42,000 per game, are in serious "phone-it-in" mode and may not bring in extra fans in Pittsburgh this time round.)

Sunday, August 31, 2014

Thursday, August 28, 2014

2014: COMPLETE GAMES #85, #86, #87, #88, #89, #90, #91...

Not surprisingly, when one's schedule gets frenetic, the gods go to work and paint you into a corner...so it was with the CG watch last week. In the midst of much furor elsewhere, we were delivered our first 4-CG day of the 2014 season (8/21). Interestingly enough, three of these were complete game losses. (We'll have to do some research to determine what day in baseball history had the most of these.)

Of the four who threw CGs that day, only Brandon McCarthy (#88, NYY vs HOU) emerged with a win--a 3-0, four-hit shutout. Dallas Keuchel (#85, HOU vs. NYY) was his unlucky counterpart in that game, making it into only the second game in which both pitchers went the distance (the other occurrence, as you may recall, was on 7/31, when the Dodgers' Clayton Kershaw beat Julio Teheran and the Braves, 2-1).

Elsewhere, the Padres' Tyson Ross (#86, 2-1 loss to the Dodgers) and recent Tiger import David Price (#87, 1-0 loss to Tampa, his old team, despite allowing just one hit) completed the rare hat trick of same-day CG losers.

So our calendar display of 2014 complete games now adds a new color to signify four CGs in a single day. (Someday we will create a CG calendar display for a pre-expansion year, and see if we can run out of colors...but that's someday.)

We should pause for a moment to note that 2014's CGs are more prevalent in the middle of the week (53 on Tuesdays-Thursdays) than on the weekend (34 on Fridays-Sundays, with just 4 on Mondays). Not meaningful, probably, but worth a passing mention.

Meanwhile, CGs continue to agglomerate: Drew Smyly, the man traded for David Price, gifted his new team (Tampa) with a two-hit shutout (CG #89, 8/22)  over Toronto (Rays won, 3-0). Madison Bumgarner (#90, 8/26) and the unsinkable Colby Lewis (#91, 8/27) both posted their second CG during the month of August.

Lewis's game is notable for being the first time in 2014 that a pitcher allowed four or more runs in a CG and was the winning pitcher. There have been only four such instances where CG pitchers have allowed 4+ R in '14: their record is now 1-3 this season. The WPCT in such games, from 1914 to now as captured in the Forman et fils Play Index, is .435 (7173-9292); since 2000, however, that WPCT value is much lower (30-147, .169), which demonstrates how complete games have increasingly become elite games.


Wednesday, August 27, 2014

GOING OWAR INSTEAD OF AWOL...TOP HITTERS IN HISTORY THRU A SLIGHTLY ALTERED LENS

We are both the first to admit and the first to claim that far too much time is spent by all variety of baseball obsessives in compiling lists of the "all-time greats." We are not immune from this behavior, though we are much more circumspect about it than most.

Oops..wrong Bill James. But you can read
an interesting account of "Seattle Bill's" life and
all-too-brief times as a pitching ace here...
It's a natural temptation in that it allows for the application of varying forms of grandiosity (even amongst those of us who work a well-practiced "aw shucks" act while spilling their opinions all over the rest of us like a drunk with trembling hands).

Bill James made such behavior safe for "the masses" thirty years ago by whipping out the systematizing apparatus attached to his "family jewels" (yes, we get extra points--and, of course, extra "goodies"--for highlighting our salacious phrases in such felicitous bad taste thanks to our sponsor "Fright Quotes R Us", or "FQRU" for short...) and publishing his Historical Abstract. (One of our favorite wags redubbed it the Hysterical Abstract--a shockingly good shoe-fit, in fact--and the wag has been dogging the tale ever since: the 1999 version of the HA re-set the standards and ground rules for grandiosity.)

Bill is also the guy who conjured up the first Wins Above Replacement (WAR) system, one of the tools that allowed him to add grandiosity to gravitas. That was actually a Good Thing, and while it (along with much else) has been used and abused over the past thirty years, the portion of WAR that measures offense is much less bloodied than its defensive counterpart. So after a sufficient number of sidelong glances, we're going to trot it out once again, albeit with a bit of a twist.

The big, honking, impossibly colorful (and likely blurry, until you find the courage of your convictions--or maybe just your parking tickets) chart that we display here uses OWAR (with data kicked out by the Play Index at Forman et fils, a place a little less like the Land of Nod than the Other Two Alternatives That Dare Not Cross Our Everlovin' Lips...) as a rate stat.

There will be objections. The first one will be global. WAR is a counting stat--or so the claim will go. Rather than bog things down further, we will simply say that we disagree. WAR is also a rate stat--if you bother to do it.

But since it's usually a means to an end even when it's advertised as an end unto itself, it's really OK to use it in unfamiliar (and, frankly, unexamined) contexts. Such as this one.

The second objection is contextual: OK, you're gonna force a rate stat version of OWAR down our throats. That's not your worst offense (and here we thought that those records had been sealed away, even from the prying eyes of the Intelius generation). But couldn't you use something more akin to the way baseball seasons work? Why the eff do you insist on using OWAR per 1000 plate appearances??

There are two reasons. First, we are just as ornery as we've always been, and there really is no better place to demonstrate that than right here. Second, we wanted a rate measure that would produce a bit more conceptual distance between the players being measured.

Nope, no Mona...at least, not yet.
So, with that, let's talk about the chart, which you've already seen above (believe us when we say we'd never make you read this much text without some images to break things up--though we stop short at showing you Derek Jeter morphed into a cheezy version of the Mona Lisa...or do we??).

The chart, OK, the chart. OWAR/1000 PAs scales it on the left, players are festooned according to their most frequently played defensive position. This shows us distributional scarcity of top-end players, and, as you'd likely expect, catchers are the scarcest in the 8+ OWAR/1000 PA configuration.

AM to DM: "The last time you
mentioned me in your goddam blog
THIS is what happened. This is your
last warning, you bum: mention me again
and I'll sue you for child support even
though you're not the father!!!"
Surprisingly (perhaps), it's not SS or 2B (the other representatives at the left extreme of Bill's "defensive spectrum"--as opposed to the "spectrum of defensiveness" that his wig-wag followers have seemingly absorbed into their bloodstream...) who are bereft of top-end offensive performers: it turns out to be third basemen (though none of them, alas, are named Vanessa Minnillo--or Alyssa Milano, for that matter).

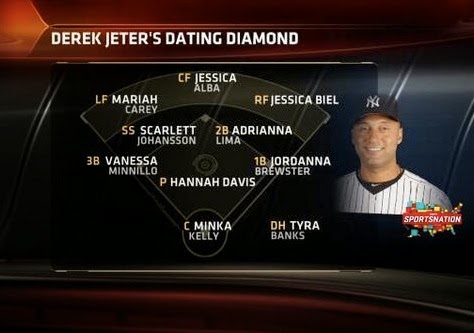
Players with less than 6000 lifetime PAs are shown with asterisks (*). Hall of Famers are shown in bold, active players in red. Players still in HoF consideration are shown in italics. And the great hitters who are the game's Meritocratic Pariahs (which happily enough, rhymes with Mariah...) are shown in plain text with boxes around them (yes, that's right, we traffic in narcosynthetic visual metaphors even while we juggle Derek's impossibly frenetic social calendar).

Many of the players in red (Joe Mauer, Andrew McCutchen, Hanley Ramirez, Ryan Braun) will likely dip below 8 OWAR/1000 PAs before they hang up their spikes, but it's interesting to catch them in mid-career just to get a sense of how their upside fits into this continuum.

And then there's A-Rod, destined to join those key Pariahs (Barry Bonds, Joe Jackson, Dick Allen, Mark McGwire) as the greatest hitters with plausible-length HoF careers to be barred from the silent room of plaques.

So--those are the best hitters of all time, according to this application of OWAR as a rate stat. Those who use WAR in its pick-up-sticks incarnation will wave it off, but so be it. (They are no longer the wave of the future anyway.) We just suggest that the compromise between moralizers and modelers be handled by adopting an approach such as this one and simply enshrining all of the hitters who appear on this list (not counting active players, of course). That's right...and that means "King Kong" Keller, too. (No, we are not shilling for the FQRU folks when we say this--though, come to think of it, what a fabulous tie-in...can you say "ca-ching"? Of course you can...hell, you KNOW you can!!)

Monday, August 18, 2014

2014: COMPLETE GAMES #83, #84

We were spared two more "cheap CGs" when the San Francisco Giants' protest was upheld and their 8/19 contest with the Cubs was "recategorized" into a suspended game.

Everyone in the Bass family is
"O-fer" vs. Rick Porcello...
Clayton Kershaw's fifth CG of 2014 (8/16, #83; keep in mind that one of these is, in fact, a "cheapie"...) proved to be the sixteenth losing distance-going effort in 2014. Kershaw gave up a couple of homers, allowing the Brewers to emerge victorious over the Dodgers, 3-2.

And last night (8/20, #84) Rick Porcello got his groove back with a three-hit shutout vs. the Rays at Tropicana Field in Tampa. The Tigers, now chasing the Royals, won 6-0 and climbed back to just a half-game back.

(Yes, some of you will notice that we cheated with the date stamp. When the post begins with an asterisk, all bets are off!)

Currently the WPCT when pitchers toss a CG in 2014 is .809 (68-16). And the current pace for CGs now sits at 108--which is an exact match for the lowest total in a season set back in 2007.

Friday, August 15, 2014

MEET THE NEW BOSS...SAME AS THE OLD BOSS

Oh, to be a fly on the wall. Fortunately, though, we've got that covered for you--with that truly unique baseball correspondent Buzzy the Fly, who not only survived a near-death experience at the hands of Commissioner-elect Rob Manfred, but has been buoyed by his participation in a special "pesticide resistance program" (which was not funded, despite rumors to the contrary, by our shadowy sponsors "Fright Quotes R Us").

We really need winged journalists these days, given that baseball's coverage often seems as "embedded" (there are those FQ's again--damn, but it's habit-forming!) as what we had to endure during the Iraq fiasco. Reading the news articles at MLB.com is the perfect cross between the Wall Street Journal editorial page and Pravda.

Buzzy, of course, has a somewhat different story about how things went down in the Baltimore putsch, much of it revolving around the real reason why resistance to Budzilla's template for corruption finally reared its ugly head.

But the bottom line is that it's still "the bottom line" that prompted the mini-revolt. Buzzy's recordings indicate that the "petulance quotient" for billionaires has followed the general trend of the stock market over the past five years.

Jerry Reinsdorf, "light-headed" back in July, was not
really the instigator of the "mini-revolt" against Rob Manfred
earlier in the week.
It's not enough to have a wired monopoly with carefully calibrated bylaws that skirt the level of scrutiny that baseball deserves to have placed on it (though, to be fair, one could say this about all too many aspects of American business).

Territorial rights and old grudges were not the true battleground in Baltimore, as has been widely reported. Buzzy's tapes indicate that it's the future of media that was instrumental in whipping up a last-minute frenzy of factionalizing. And part of the fallout in that area has to do with who will control the creation of "advanced data."

Now, none of these folk can be seen as the "good guys" (FQ alert). But it was Budzilla who decided to leave the "advanced data/media" issues in the roiling region of endless entrepreneurial kerfuffle. And his hand-picked successor Manfred will do the same. As certain owners have discovered, that is actually more of a constraining scenario for the use and growth of such information products than it is an opportunity or a strategic advantage.

This situation was not "resolved," it was simply tabled. But what it means for the next seven years is that we'll have more of the same with respect to the blighted vision of the game that has prevailed. The reign of an approach utilizing ineffectual committees whose answers are known before the questions are even posed will continue. Manfred will do his best to live up to The Who's dismay in "Won't Get Fooled Again": "Meet the new boss...same as the old boss."

But it's not an issue that will stay tabled for long. We may need to have Buzzy train an army of winged correspondents to keep up with this.

2014: COMPLETE GAME #82

The Royals have gotten hot again, and it's hard to argue with the fact that they've been doing some of that against good teams (though it's possible to wonder if Billy Beane didn't leave his offense just a little too depleted--particularly from the right side of the plate--in his reaching out for Jon Lester). The KC strengths (bullpen, defense) have been boosted of late by an uptick in hitting (particularly in clutch situations).

And now Jason Vargas. Like Ervin Santana last year, Jason has found a way (thus far) to keep the ball in the park--something that's not really been his forte in the past. Oddly, however, he's not really pitched all that well at Kauffman Stadium this year (4.27 ERA vs. 2.16 on the road).

QMAX (aka the Quality Matrix) shows us that Jason's 2014 numbers aren't really that much better than his lifetime performance. His QWP is only .520. His QERA+ (our version of adjusted ERA) is 104.

But what can one say after a three-hit shutout in which he retired the last 23 batters he faced? What Sandy Koufax said in his autobiography--we paraphrase: "[The .500 pitcher] always looks better than he really is, because his good starts are so good."

The Royals are looking to make the playoffs with eight of their ten regular hitters producing OPS+ values below league average. Their starting rotation is overachieving (QMAX and FIP, as is often the case, are in agreement here). But they have a favorable schedule down the stretch. It won't only be the "midwestern angsters" who'll be holding their breath.

Getting back on topic for the post: CGs have slowed down again in the past week. The projected total for 2014 has slipped back to 109. (The record for fewest CGs in a season, you might remember, is 108).