THE point is more than noted that those .400 "half-seasons" we showed you last time don't really mean much to modern-day fans (and even less to that caviling cadre of splenetic "analysts").
This is due to the continuing relentless assault on batting average--and the fact that half-seasons have never meant anything to anyone in terms of analysis. (The ruts we are stuck in are deep and muddy...)

But as you might expect, our response to this is exactly the same as the one that the Reverend Scot Sloane gave to Joan Caucus when she dumped him...
BUT we still say that half-season peaks are a way to grasp what's realistically possible for hitters for a reasonably sustained time period. We saw that in such a formulation, .400+ hitters are still rare (accounting for only 8% of the Top 600 (Top 300 for first half/second half, combined into one data set). A .500+ on-base average is also quite rare: at the seasonal level, it's actually rarer than a .400 batting average (going back all the way to 1871, only 21 instances in baseball history, as opposed to 35 .400 hitters).
So what about .500+ OBP half-seasons? How many of those are in the Top 600? The total for .400 hitters was 48; the total number of .500+ OBP half-seasons turns out to be just slightly more than that, with 52.
How many of these .500+ OBP half-seasons come from players who also hit .400+ during the half-season in question? Glad you asked...

So there are 14 half-seasons where a .500+ OBP is accompanied by a .400+ BA. We've listed them above in descending order of BA. The three hitters who've done this the most are Tris Speaker, Rogers Hornsby, and Ted Williams (three times each). Ty Cobb managed to do it twice; the other three hitters who managed to do it once are Babe Ruth, Harry Heilmann and Barry Bonds.
Of course, you've seen these guys before--twice before, in fact...first when we published the chronological lists of the two Top 300 half-seasons (second half, then first half), and again in our last post. Now you'll see the 38 other hitters who achieved a 500+ OBP without also hitting .400. (Quick question for you to ponder: has there ever been anyone in baseball history whose had a .500+ OBP over a half-season while hitting less than .300? The answer is coming up, but first, here are the hitters with .500+ half-season OBPs whose BAs are between .360-.399:
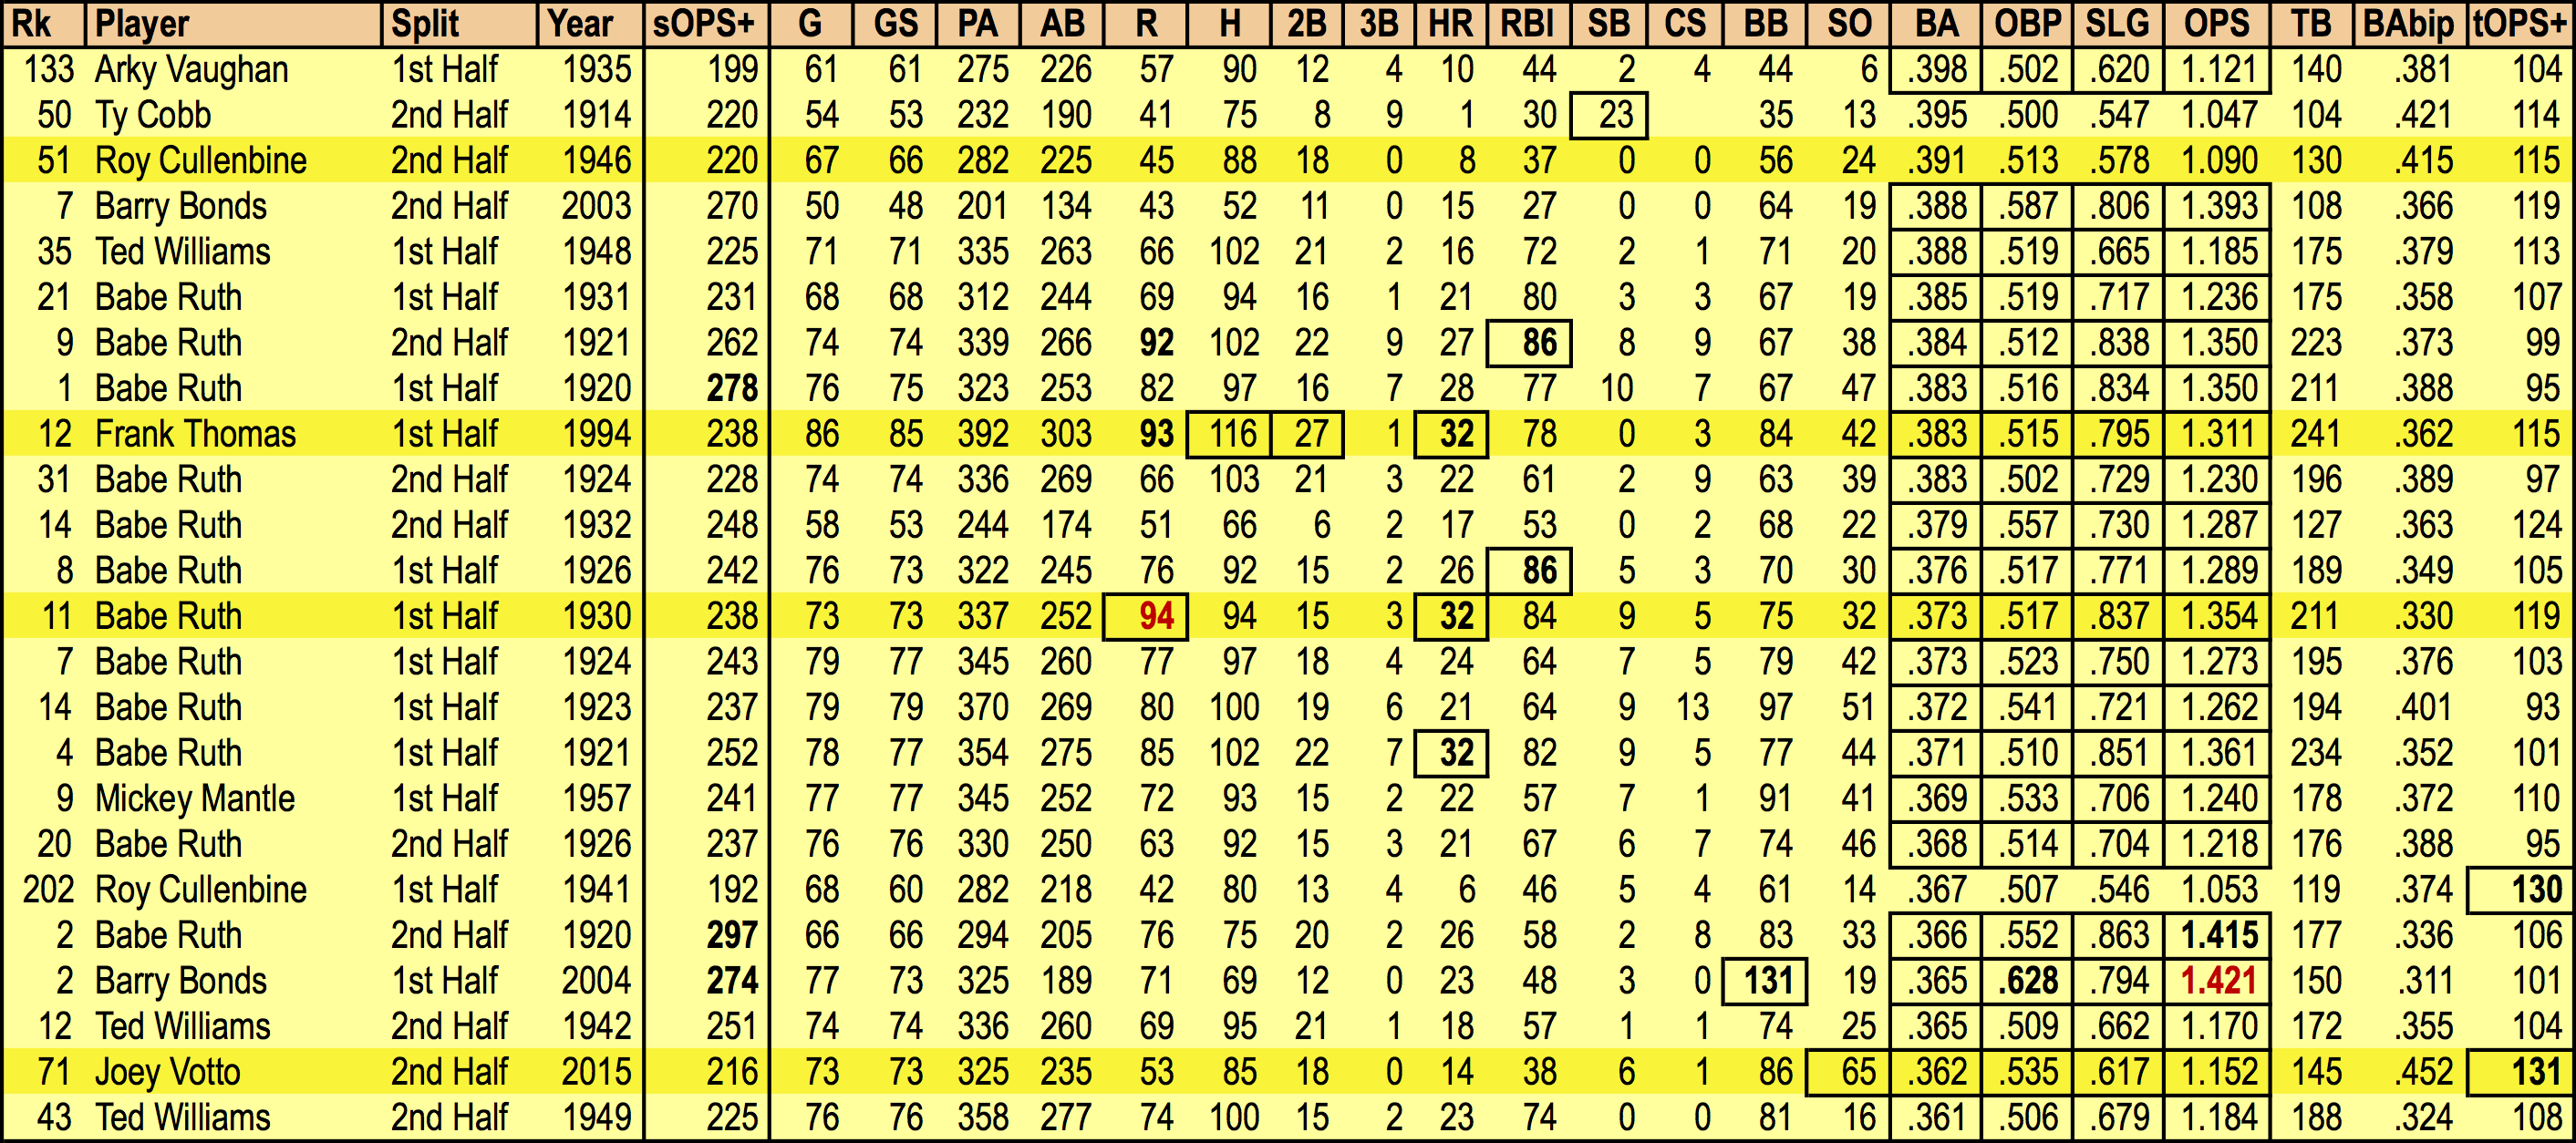
Again, these are displayed in descending order of batting average (just because we can!). We've just highlighted a few of the 24 .500+ OBP half-seasons for you here: first, one of twelve (!!) Babe Ruth half-seasons that are part of this BA range, from 1930, one of the two half-seasons here where he hit 32 homers (a total later tied by Frank Thomas in 1994, which we've also highlighted). We've highlighted Joey Votto for being the most recent member of the list; in context, and we've picked the second of two .500+ OBP half-seasons by our man Roy Cullenbine--a man who wasn't really used full time in either of the seasons in which he peaked. (There are 24 half-seasons in the above table, but only eight other hitters aside from Cullenbine, who's easily the most anonymous of the bunch. Not any more!)
Now, if you're reading the BB column, you already know that these guys are walking a lot (even the guys hitting .400+ in these half-seasons are safely above league average in that category). But perhaps Barry Bonds' first half of 2004 is leaping out at you...that walk total is not a misprint (131 walks in half a season!). Just imagine what it's going to take in terms of BBs for anyone to amass a .500+ OBP while hitting less than .300. (Do you have a guess as to whom that lone individual is? Make it quick, because he's coming right up...)

If you guessed Bonds, you were right on the money: he did it in the first half of his final season in 2007. (BTW, we can get a "back to front" look at Bonds for second half of 2001/first half of 2002 in this data cluster: for that time frame, Barry hit 61 HRs, drove in 121, scored 131 times, drew 198 walks, and hit .351. We'll have more "back to front" data for you as we get closer to Opening Day.)

Let's run a Time-Grid™ chart for the 52 .500+ OBP guys, so we can see what the historical pattern looks like...as will be clear, the major uplift for these occurrences can be found in three decades, the 1920s, the 1940s, and the 2000s--occurrences which are tied primarily to the three most dominant hitters in baseball history: Babe Ruth, Ted Williams, and Barry Bonds. Of course, Ruth had help from Speaker and Hornsby, which is why you have 18 of the occurrences in that decade (representing just a tad more than a third of the total number of instances). Williams is the spear-carrier for the 1940s, though his most dominant half-season occurs late in his career, in that magical second half of 1957. The 2000s light up the board primarily due to Bonds.

What the chart shows is that the BBP range is always well above league average, but extends out to percentages that seem utterly surreal (a 40+% BBP rate?). The color coding of the data points give us a chance to see the placement of seasons from Ruth (data points filled in with black), Williams (data points filled in with orange) and Bonds (data points filled in with yellow). As you can see, they each inhabit a specific region in the chart. In Bonds' case, it's literally a region where no man has gone before.
Note the data point in gold--that's Heilmann, with 12% BBO and a solid but not spectacular ISO (.273). (Remember that Harry's the one who hit .457 in his second half.) And then check out the two data points in red--another singular region occupied by the only moderately powerful Roy Cullenbine. (The five players below Roy in ISO are all guys from the Deadball Era--Ty Cobb, Frank Chance, John McGraw--or from the early 1920s: Tris Speaker. We are not likely to pass that way again, though we can keep a candle in the window in hopes for a half-season like Cullenbine's.) The closest to such a season is captured by the data point in green: that's Joey Votto in 2015. Because of his HRs, he's not really all that close to Roy.
We'll be back a bit later on to show you all the hitters who cracked into the half-season Top 600 exactly once. Then we'll go "up the food chain" and show you the folks who made the list on two or more occasions. You can probably guess who has the most of these based on what you've seen here, but there will still be some surprises along the way...stay tuned.