
And we might just find a way to adjust some of our perceptions about that period accordingly.
The following counting stats were compiled for 1876-1995 and for 1876-2010: runs scored, hits, doubles, triples, home runs, total bases, runs batted in, bases on balls, extra base hits.

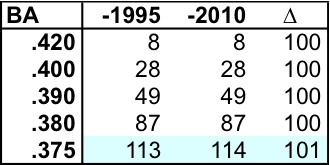
These are frequency distributions; that is, the number of times someone has reached a particular number in the statistical categories. Lets use home runs as the example, since it's the "big ticket" item in more senses than one. Looking at the chart, we see that the number of 40+ homer seasons has nearly doubled since 1995 (the ∆ column measures the change as a value comparing the 2010 frequency to 1995's, which was set at 100).
Of course, this chart tells you what you already know: that the home run dominated the past fifteen years and hitters completely rewrote the record book at all thresholds. But you may not have seen the data presented in exactly this way before.
 What we'll do now is look at four groupings of these stats based on the amount of change to the frequency distributions that occurred. We are mixing together the counting and the derived stats here, and that mixture will make for an interesting depiction of the shape of the changes that occurred as a result of how the game was played over the past fifteen years.
 The low change group, in keeping with what we know as the distinguishing feature of the 1995-2010 time frame--the rise of isolated power as a result of the home run explosion, is not all that surprising: batting average, triples, hits, and runs scored (the distribution of runs scored throughout the batting order has shifted subtly, and has served to dampen the level of change for individual players).
The upper echelons of the other stats seem impervious to any assault at this point, due to the increasing uniformity of hitting styles over the past fifteen years.


 If you think about it, it makes sense that SLG by itself hasn't gone through the roof. High SLG requires high batting average or a massive infusion of extra-base hits as a percentage of total hits. The former drove the records set in the 20s and 30s; the latter drove the overall increase in isolated power that occurred over the past fifteen years, but doesn't necessarily translate into high SLG seasons for individuals. Coupled with the lag in BB, that also tends to dampen the effect on OPS.

 The pronounced change group makes for an interesting linkage that could ruffle some feathers in the numbers world. The three stats in this group are runs created, total bases, and runs batted in. Ah, but aren't RBIs supposed to meaningless outside of particular contexts? This is a long-standing ideological canard that's more of an "us vs. them" litmus test for "the cause" than it is a particularly objective look at how RBI have functioned in the game itself. The fact that RBI are linked with two totalizing stats such as total bases and runs created indicate that there are associations between the stats that go deep into the structure of how batting orders work, and why it still makes sense to "concentrate one's fire" in terms of where to bat one's best hitter.
Runs created, being a stat that models performance, operates differently and has something of a divergent profile across its thresholds. A good bit of that, of course, is Barry Bonds, and it could be that if we simply removed Bonds from the sample, we'd find that the RC numbers are a lot more similar to the RBI and TB distributions. And wouldn't that be disturbing to the folks who still need to bash RBI!
 Finally, the high change group, four stats that should be no particular surprise at this point (no real "mystery guests" here): we are talking about isolated power, extra-base hits, doubles, and home runs.
 One of these stats is a bit unlike the others, however, in that the overall shape of its change diverges from the "destroy the top end" approach of the other three. Which is that? It's doubles, where the assault is clearly concentrated at lower thresholds.
 The consistency of gain in isolated power is more similar to the home run data than it is to the overall extra-base hit data, which again indicates that home run hitting has driven the shape of offensive upswing over the past fifteen years. Most of the work in rewriting the record book, then, can be seen as the doing of just a few players, with Bonds--the great lightning rod for a "tainted" era--stepping up to the play as combination hero/anti-Christ.
We'll come back and examine this same idea, applied to the fifteen years between 1919 and 1934--a time frame of at least equally significant change to both the game and to its record book--a bit later on.