Willie Mays is 80 today, and we thought it would be fun to break out his career stats in a way that probably hasn't been seen before.
We'll never know if Willie might have gotten to Babe Ruth's home run record (Ruth? Home run record?? Anyone remember that???) had he not missed time in 1952 and 1953 due to military service, but many folks still think of him as the greatest all-around player they ever saw--the rough lineage of this concept probably being Honus Wagner-Ty Cobb-Babe Ruth-Joe DiMaggio-Willie Mays: and then we are into the limbo of an overspecialized game where no one player could embody the attributes that could mean all things to all men.
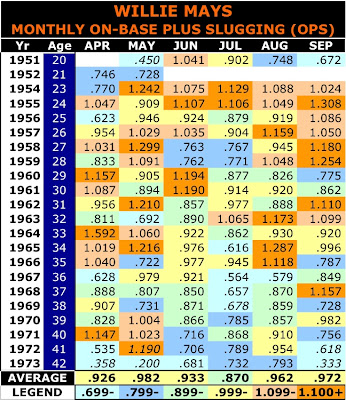
The chart below summarizes Willie's monthly "hitting pulse" across his career, and we've color-coded it to show "hot" and "cold" a la the au courant "heat charts" which have proliferated across many "advanced metrics" sites like hyperactively horny rabbits--and that often make you think you're experiencing a combination acid flashback and Rorschach test.
There are 127 months represented, and the distribution of Mays' performance in these monthly rectangles is interestingly linear/regular. There are 22 months where he was ultra hot (1.100+ OPS); 21 where he was hot (1.000-1.099 OPS); 26 where he was simply his own self (.900-.999), 22 where he was merely a very good major league player (.800-.899); 21 where he was in a mild funk (.700-.799, which is still in the range of "league average"); and 15 where he was cold to very cold (.699 OPS and below).
(The data values in italics are months where Willie had less than 50 plate appearances.)
The notion that hitters peak at a young age is reinforced by this chart. (Though, yes, to make this more accurate, we need league-adjusted OPS to counteract the effects of the offensive decline in 1963-68). From 1954-59, Mays' months are ultra hot or hot twenty times out of a possible thirty-six, or 56% of the time. And by strapping together months across years, we can see that Willie was playing exceptionally well across the last half of 1963 and the first half of 1964, putting together five straight months in the "orange zone" (matching his feat in 1954). [EDIT: Using David Pinto's Day-By-Day Database, we can see that Willie hit .362 during this time frame, with 42 HRs in 123 games. That's a .722 SLG and an OPS of 1.143.]
Looking at the data vertically, we can see that Willie just seemed to have a swoon in July (a month later than the infamous "June swoon" so often referred to by Giants fans as a feature of team's performance: we'll look at that sometime and see if it is truth or fiction). Distribution of "ultra" and "hot" months as actual months goes like this: April 8, May 9, June 7, July 3, August 7, September 9. Distribution of "funk" and "cold/frigid" months: April 5, May 5, June 5, July 8, August 3, September 5 (not counting months with less than 50 PAs).
The average OPS values show that Willie was at his best in May, took a dip in the middle of the year, and found a "second wind" in time for the stretch drive. One exception to that can be seen in 1971, when the 40-year old Mays was sizzling at the start of the year to help the Giants into a big early lead, and both he and they coasted into the playoffs.
One final comparison might pinpoint when Willie's downward turn occurred. The first three months of 1956 and 1967 look awfully similar (though, again, we need league-adjusted OPS for best accuracy). In July of '67, however, it looks as though Willie hit the wall. When you look at the full chart again in light of this comparison, you can sense in the color-coding from that point downward a vivid visual representation of what analysts like to call a "decline phase."
Happy birthday, Willie, and thanks for the memories.


