Sunday, November 27, 2011

LATE-BLOOMERS, THE HOF, AND THE AGE 32/33 DIVIDE...

We will now officially "cherry-pick" from BTF (Baseball Think Factory) the way they do from everyone else.

The fugitive world of baseball statistics is fast becoming meta-parasitic anyway, and the handy chart compiled by the embedded insurgent renegade group RBI, showing how the types of parasitism in baseball discourse have operated over the past few seasons (with an entirely new strain emerging in the past year), is a telling indicator of the (apparently) inevitable direction that things are taking.

So, when in a Petri dish...

Actually, we are stealing our own list out of a thread that has grown as frayed and brittle as many of them do over at the Shrink Factory, where fabric softener is no longer an optional product. The list came from a bit of business following up a slice of commentary at Bill James' web site, where registered site visitors can engage Bill in questions and comments, sometimes about baseball, sometimes not.

In this case, it was a set of related questions about the Hall of Fame likelihood for two highly regarded late-blooming infielders, the Phillies' Chase Utley (right) and the Red Sox' Kevin Youkilis (left)--who are both turning 33 prior to the start of the 2012 season, and who are showing some signs that they might not be able to sustain the career momentum necessary to power their way into Cooperstown.

Both players have a 127 OPS+ going into next season, but there's a difference in their number of career games played--Utley (1109) has about 200 more than Youkilis (911). James noted the small number of players in the Hall with less than 1,000 games at the age of 32, and pretty much consigned these two also-ran status.

That got us thinking about the players who were like these two--as good or better--who'd come up late and had somewhere between 911 and 1109 games in their careers at age 32. How many were there? How many of them have made it into the Hall? Are there other late bloomers who've been overlooked in terms of the Hall due to short careers?

We went to Forman et fil and created a list of players in what we might call the "Utley-Youkilis Gap." It turns out there are 29 of them. We've sorted them into the list below at right, and will now proceed to explain (as best possible) what all the freakin' color-coding means.

First, the players in "hard orange" are the four who beat the odds and made it into the HoF--Kiki Cuyler, Bill Terry, Earle Combs, and Earl Averill.

The rest are color-coded by the number of games they played from age 33 on. The guys with 800 or more games played from age 33 are listed in two different color schemes (we'll explain the reason for this later--three (Ken Williams, Edgar Martinez, Bob Johnson) are in light orange, while two (Brian Giles, Rico Carty) are in pink.

We did the same thing with the guys with 600-799 games played at age 33 on. Two (Jack Fournier, Dolph Camilli) are in yellow; one (Cliff Johnson) is in blue. (Can you figure out why the reason for the subcategorization?)

The players with 400-599 games (actually 598, we cheated to get Camilli on the earlier list)  are coded in dark green; those with 200-399 games are shown in light green.

Everyone with 0-199 games is shown in light blue.

Edgar Martinez
The separation of the top groups into two separate color codings is to differentiate the players whose OPS+ averages actually increased in their 33-year and up seasons. Five players did that: Williams, Martinez, Bob Johnson, Fournier, Camilli.  Only three of these guys saw their OPS+ averages and their WAR totals increase: Williams, Martinez, Bob Johnson.

And those are the three guys who, in our estimation, deserve to be in the Hall of Fame.

They beat the odds. Everyone lost fifteen points off their OPS and saw their WAR total drop 60% in the 33+ age window.

These guys went the other way--and actually played more games from age 33 on than they did through age 32.

"Indian" Bob Johnson
Edgar, of course, is the current case--and we're just going to have to hope that the BBWAA gives him a full ride over the ballot process. This next vote will give us a much better sense of how things are going to go--with any luck, Edgar will go up into the mid-to-high 40s due to the lull in the coming "perfect storm" of HoF candidates that will arrive beginning in 2013.

Johnson and Williams are going to require a lot of proselytizing--and it won't be a walk in the park, even compared with the arduous efforts expended on behalf of Bert Blyleven. However, it's easier to convince a VC body than the full BBWAA, so educating folks as to just how rare it is to beat your "decline phase" is something that's possible with such a small group. Or so we can hope.

We wouldn't give much for either Johnson or Williams' chances. But both did a wonderful job of defying time, and this is a very rare achievement worthy of recognition.

(BTW, the numbers for "UTLEY" and "YOUKILIS" on the big chart are not for the individuals, but for the groups broken out by the thick line between Riggs Stephenson and Earl Averill. The "Utley group" is above (more than 911, less than 1109 games at 32). The "Youkilis group" is below (less than 911 games).

Ken Williams
It's going to be harder for Utley to play more games after 33 than through 32 than it will be for Youkilis, but if he could do so, it would probably mean enshrinement (especially if he can manage to stay a second baseman well into his late 30s). Chase is farther advanced WAR-wise than anyone else on the list (Terry gives him a very close run for his money, but Bill is one of the ~30% of these guys who had a better year at 33 than at 32. Utley really needs to do the same: he's going to need to shake off the injuries that have slowed his meteoric rise.

Youk made a successful move to third base last year, but his body type is such that it doesn't seem plausible for this switch to be viable for more than a couple of more years. He needs the Red Sox to decide that he's indispensable in their lineup: he's got about a 14% home park advantage at Fenway, which is exceptionally well-suited to his doubles-centric batting style. If he tries to jack up his HR totals, it might backfire on him, causing his BA to drop too much to keep him in MVP contention.

What did the "Gang of 29" do in their age-32 and age-33 years? Their aggregate OPS+ dropped from 134 to 119. They lost about 18% in WAR, a shade under 12% in OPS. Career-wise, they plated just over half the number of games they'd managed through age 32 from age 33 on.

I expect Utley and Youkilis to beat that 50% figure, but they probably won't break 70%. Clearly, the higher this percentage, the greater chance they'll have for Cooperstown. Utley has the better shot, given his head start in games and the fact that he's been playing the tougher defensive position.

What's also clear is that this group of late-blooming players is quite interesting unto itself. They still need a shortstop and a catcher to be able to field a full team, but they'd be an awfully solid hitting unit if they could do that.

Tuesday, November 22, 2011

A FLUKE FOR ALL TIME, or: QMAX AND STARTING PITCHER MVPs


We weren't quite expecting Justin Verlander to become a double award winner this year, but the BB-WAA has had its way with us. Rather than remain doctrinaire, we figured it might be worth using the Quality Matrix (QMAX) to examine Verlander in the context of those starting pitchers who've won the MVP award.

In our previous entry we showed how closely bunched four NL pitchers (Clayton Kershaw, Roy Halladay, Cliff Lee, and Cole Hamels) were in the QMAX data. Given that QMAX is a 7 x 7 bidirectional matrix, it's probably not surprising to you that the aggregate average in any given year is somewhere around 7--which is right at the dead center of the matrix chart. As offensive levels change, that average fluctuates up and down--from a low of 6.81 in 1968 to a high of 7.59 in 2000.

So you can see that scores around 5 are excellent and usually match up well with an ERA+ between 145 and 160. The fluctuations in ERA+ generally have to do with individual factors--flukes of clutch pitching, or extremely low distributions of extra-base hits, etc.--that pull away from QMAX's large-scale probabilistic centrifugal force.

OK, enough of that, let's try to contextualize Verlander using QMAX. How does his season compare to the other starting pitchers who either won both the CYA and MVP, or won the MVP prior to the creation of the CYA, or who won the CYA and were strongly ballyhooed for the MVP?

Let's cut right to the QMAX value chart, the basic QMAX average and the Quality Winning Percentage (QWP).

Don Newcombe in his heyday...

We can see that while Verlander ranks seventh in the overall QMAX score and sixth in QWP, his "T" score of 4.92 and his .725 QWP is well within the range of performance where pitchers have been awarded MVPs as well as CYAs. (Don Newcombe, the first pitcher to win a CYA, and who also won the MVP award that year in large part due to his winning 27 games, has the lowest QWP of any of these pitchers.)

Verlander's 2011 season, from the basic QMAX data, looks like pretty much a dead ringer for Roger Clemens' 1986 season.

But this is where we can bring in QMAX's "shape" component to add context to the basic data. The QMAX range data is extremely suggestive in providing us with a series of percentages for performance criteria within the expanse of the QMAX matrix chart.

We want to look at the ranges within the QMAX chart that seem to have the greatest "range" (distance from the best score to the worst from among pitchers in this most distinguished sample). When we examine the QMAX range chart, we can see that the range categories that show the most fluctuation are the "Elite Square" (ES) and the "Hit Hard" (HH) sector.

We can see that with respect to those stats, Verlander is again down in the pack a bit. His ES score is seventh best and his HH percentage, while excellent (the average AL pitcher was hit hard in 30% of his starts during 2011), is tied for sixth in this rarefied company.

We follow with a whole series of QMAX charts for these pitchers, and we will conclude by adding the QMAX data for three pitchers not on the current list--Ron Guidry and his storybook 25-3 season with the Yankees in 1978; Pedro Martinez' best-ever season in 2000 (even though most would expect us to be looking at 1999 instead, when Pudge Rodriguez beat him out for MVP); and Zack Greinke in his much ballyhooed 2009 campaign.

What these charts mostly tell you is that great pitchers have very similar success patterns. They may flip-flop on their top hit prevention (S12) games--some have more in the "1" (most dominant) area, some have it in "2", but these games constitute at least 50% of all their starts. In the case of Bob Gibson and his legendary 1968 season, that figure breaks 75%.

Denny McLain isn't really given all that much credit for his achievements in 1968--the modern low point in run scoring has become a bit exaggerated, and the campaign against the value of wins has also caused many to put aside his 31-win season. (It's now been longer since McLain achieved this feat in 1968--forty-three years and counting--that it was between McLain and Dizzy Dean, who did in 1934. It will probably be a whole lot longer before anyone does it again.) He also suffers in comparison to Gibson's incredible achievement.

Bobby Shantz--a true "pocket ace" in 1952
Of the three pre-1960 pitchers on this list (Newcombe, Bobby Shantz, Hal Newhouser) that we chose to include, it's Shantz' season that is the most notable--if only for the fact that Bobby was one of the tiniest aces in baseball history. (Forman et fils lists him at 5'6" and 139 lbs.--now that's not just tiny, that's virtually nonexistent.)

A look at Shantz' game logs in 1952 shows that he was on his way to a sub-4 QMAX season as late as August 22nd (when his record was 22-4, 1.81), but he just didn't have the stamina to sustain such an effort over a full season and he faded badly in September. (Five of the seven games that Shantz had in the "HH" category came in his last ten starts of the season, a sign that the little lefty was simply gassed. And, of course, he never came close to duplicating his 1952 performance.)

That leads us to the three might-have-been MVPs--Guidry, Martinez, and Greinke. When we look at the basic data, we start to get a sense that something is out of order with one of these guys. Whereas nobody in the original CYA/MVP list shows up with a "T" score higher than 5.1 or a QWP lower than .680, all of a sudden we have one "legendary" season--Greinke's 2009--that looks more than a little pekid.

We'll get back to that in awhile. What's clear from the rest of the data above (and in the associated QMAX range data) is that Guidry was right in the pocket for the double trophy.

Pedro Martinez: in 2000, that upwardly-pointed finger
gave him direct access to whatever celestial deity
floats your boat...
And Pedro's 2000 season, despite being lower in wins (18-6 vs. 23-4 in 1999), is the truly killer year for him, with only Gibson's 1968 being in its gunsights. He holds the record for all of the QMAX range categories (save the "TJ" and "PP" ranges, shown in green because they are most descriptive and not a direct measure of performance).

Now you may be wondering why Pedro's basic QMAX score (3.79) is higher than Gibson's (3.68).  The answer is that there's a difference in the winning percentages for each QMAX cell in 2000 than in 1968. That difference across the entire matrix means that the value of a 1,1 game is a few points of WPCT higher in 2000 than was the case in 1968. Thus QMAX is also era-adjusted (taking away another of the original objections that surfaced when this method was introduced in the mid-90s). While the basic S, C, T numbers do not change, the "win values" for the cells do fluctuate from year to year. The effect is not as striking as some of the other "sabe-centric" adjustments that have become popular, but it does correct for run-scoring levels appropriately.

But let's get back to Greinke. This is a guy whose 2009 season has been spoken of in hushed tones by an large coterie of baseball folks. An adjusted ERA (ERA+) of 205, for Crissakes. How can he be showing up so poorly in comparison to the rest of these guys? Surely that means that QMAX is full of it, nicht war?

Sorry, the answer is "nein." Remember that we've always pointed out that QMAX is a probabilistic system. While it does correct for XB/H in the "S" value, it doesn't attempt to be as precise as what all the other systems do when they simply start with runs. What QMAX does is tell you with all reasonable conditions controlled for and with baserunner strand rates assumed to fall within relatively narrow range parameters, this is what you can expect from the hit and walk prevention figures that it computes.

So why does it vary so much with respect to Greinke? Well, there are some odd aspects to Zack's 2009. It turns out that Zack had an incredibly hot start (0.94 ERA and 8-1 record in his first ten starts) and a blistering finish (5-0 and a 1.29 ERA over his last eight starts). In between those two streaks, however, he was just about a league average pitcher (3.66 ERA and a 3-7 record).

Let's look at the QMAX range data for Zack as it maps out for the 18-game "Buddha" period in 2009, and for the 15-game "Bubba" period. Remember, Greinke has a 1.29 ERA in that first group, a figure that should by all rights be producing a sub-4 QMAX "T" score a la Gibson and Pedro, but instead is coming out in the high 4's--great, but nowhere near the "godhead" level.

In the other 15 games, he's a very hittable pitcher with good control, and he's just barely more than a .500 pitcher. This evaluation is supported by the range data, which shows that Greinke had 55% of an historic season in 2009, and 45% of a season where he was--in the immortal words of Zbigniew Bzrezinski: "Meh."

The Bzrezinskian "grand chessboard" might be an excuse for the 
strategic deployment of dirty bombs, but it's no match for the geopolitical 
pitching intricacies as they are laid out in the QMAX matrix chart...
But so what, you say? The adjusted ERA is what matters, right? And the fact that his other measures--his BABIP, for example--doesn't point to great luck? Who cares? You don't even want to use runs in this crazy system!

Ah, but that's the point. A counter-intuitive system needs to have something that it uses as a fulcrum. FIP-based stats use BABIP as that fulcrum, pretending that it's random enough to operate that way, preferring to believe that the slice of data that it uses is somehow sufficient to leach out all the "fielding luck."

In QMAX that fulcrum is the strand rate, which can either be measured directly or can be simulated (just as BABIP acts a proxy in that system for focusing only on balls in play) by looking at the difference in batter vs. pitcher OPS in general and a key subset of that measure--batter vs. pitcher OPS with men on base.

You want to argue as to which one is more "valid"? Are any of these measures necessarily more "valid" than any others? Take a shot at it. Take your best shot. What might just be mind-opening is to take a look at the deviation in those two batter vs. pitcher OPS figures and see if they point in one particular direction, and whether Greinke might just have had one of the most aberrantly brilliant seasons in baseball history.

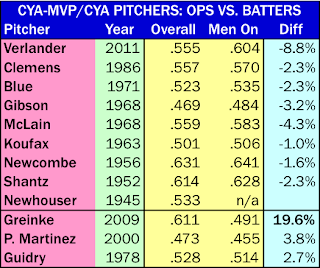
The chart at right shows those figures for the twelve pitchers we've looked at in this study. As you can see, while there are some differences, the major trend for these pitchers with respect to batter vs. pitcher OPS is for that figure to rise when men are on base. There are three exceptions to this: Guidry, Pedro, and--

Oh my god. Look at that outlier for Greinke. The average differential for this comparison over all of MLB in 2011 is -3.4% (.780 OPS with men on vs. .754 OPS overall).

Greinke's batter vs. pitcher OPS with men on base in 2009 was about 20% better than it was overall.

That is how his ERA ended up being so low for the year. It was a year of pitching unconsciously when men were on base. This is the textbook extreme of how one maximizes performance elements into a season of overachievement.

Sure, we can give Greinke credit for his great and sustained clutch performance over 2009. And let's face it, the fact that he was in Kansas City that year made it certain that he would get adulation from the sabe-centric world. Joe Posnanski, maybe the key fence-straddler in the mainstream media with his ties to Bill James and his folksy, aberrantly experimental writing forays--and his unique access to the socially challenged Greinke--made absolutely sure of that. Quirky anti-folk hero? Check. Struggling small market team? Double check. All "sympathetic trope systems" were "go." Pos's brilliant proselytizing for Greinke, timed to the tail end of his first hot streak, opened the door for many other sportswriters, and there was undoubtedly a domino effect when it came time for the CYA voting. Zack didn't hurt his chances by getting white hot down the last six weeks of the season, either.

Greinke in 2009: a dominance created by a fast start, 
historic clutch pitching and a brilliant tout 
from Joe Pos...not from his hit prevention!
But what QMAX tells us is that it was a glorious fluke season of overachieving greatness, propelled by a stat that's much more of an outlier than any of the BABIP data in the "fielding independent" cigar box.

And you will note that Greinke has never come close to doing that again, either before or since.

In fact, usually the greater the pitcher, the closer these two OPS figures cling to one another.

QMAX assumes that this will be the case. Therefore, it stubbornly--and correctly--suggests that Greinke's true value in 2009 was a good bit lower than what the ERA/ERA+ (and WAR data) suggests..

Now this isn't going to help get QMAX accepted in the little sabe-centric world. They like their myths, especially when the myth looks empirically, walks empiricially, and talks empirically like a duck. After all, that 205 ERA+ is real: it really happened. The fact that it may be part of a different type of illusion, one that has yet to recognized, is unlikely to register at this time. The underlying feeling from this piece for many will be that we're trying to "take down" Greinke--who, having moved to another midwest franchise that actually made its move into the playoffs, is still benefitting from the original halo effect. And that's not going to sit well.

But keep in mind that Greinke has never come close to that season. His next best ERA+ to that 205 in 2009 was 126 the previous year. The fact that his QWP was actually only .640 in 2009 tells us that he really hasn't fallen as far from his "peak" has is commonly thought. His .566 QWP in 2011 could well be  his true level--unless he goes unconscious with men on base again.

But chances are that he'll always be thought of as someone who showed a singular glimpse of unalloyed greatness. After all, that's kinder and gentler (and more in keeping with this most emprirical of myths) than calling it a "fluke."

How about we just agree to call it the "greatest and grandest fluke in the history of baseball"? That sounds more positive, to be sure--and it also happens to be the stone cold truth.

Friday, November 18, 2011

NL QMAX UPDATE: HAMELS AND LINCECUM

Cole Hamels defenders have a right to be wondering the following:

--Why he finished fifth in the NL CYA behind Ian Kennedy;
--Why we left him out of our earlier discussion.

Our conjecture concerning the former is that voters (who are political as much as they are analytical) simply didn't want to have a monolithic vote for Philadelphia pitchers.

That's understandable, but not necessarily condonable.

We simply got so caught up in Phase I of the hand-to-hand combat over Clayton Kershaw that we simply neglected to run the numbers for Hamels. (And, sure, we were occupied sharpening our knives.)

When we run the QMAX numbers for Hamels, we discover that there is a fourth pitcher who deserves to be in the thick of the discussion. According to our numbers, he is just a razor's edge behind Roy Halladay and Cliff Lee and the difference is slight enough that it's clearly "throw a blanket over 'em" time.

Hamels' QWP is .667, just a tad under the other two Phillies aces. (Note: we do not include Hamels' relief tune-up performance on the final day of the season in these calculations.) His top hit prevention percentage (S12) is 52%, comparing favorably with Lee (50%) and just under Kershaw (58%) and Tim Lincecum (55%).

Another reason why Hamels may have been downgraded to fifth is that the lessons of last year (King Felix's AL CYA win despite a 13-12 record) have not quite percolated down into the lower levels of the ballot process. Again, understandable but not condonable. Hamels had the least number of wins out of the great Philly troika, but a strong case can be made that these guys finished in a dead heat.

Here are the expanded QMAX rankings and range data lists, which include Hamels and Lincecum, who finished sixth on the ballot. Rob Neyer is once again overreacting with a strange variant of the Stalinism that seems to infect those who wrap their lips around the Fangraphs exhaust pipe, excoriating the stray voters who picked The Freak over Hamels or Kennedy, but these votes may well have come from a different impetus.

Lincecum had the worst run support of anyone in the NL last year. The Giants scored an average of 2.81 runs in his starts. Quite possibly these were sympathy votes: possibly a bit more condonable than missing the true level of Hamels' achievement.

QMAX suggests that the voting order for the NL CYA is Kershaw, Halladay, Lee, Hamels, Kennedy. If that gets us excommunicated from the little world of sabermetrics (wait, didn't that already happen at least once??), then so be it.

QMAX SMOKES OUT THE CYA--NL & ELSEWHERE

That skunky smell you may be noticing is emanating out of the virtual cubicles at SB Nation, where BMOC Rob Neyer is wasting no time in proving our point about the vagaries of sabe-centric dogmatism, as referenced in our most recent post (!!), where we alluded to:

"the strange intractability inherent in the war over WAR, the guerrilla infighting, the race to phantom regions of moral rectitude..."

Now Bill James really is to blame for all of this--it was his high moral tone in the midst of his long-term, intransigent gadfly-ism that set the bar for the knee-jerk "us vs. them" mentality that Neyer and others have absorbed through the pores. Consequently it has made a quest that should have been conducted from the cerebrum into something that continues to be ruled by the cerebellum, despite all of the metamathematical anathemas that the Whole Sick Crew has been conjuring for better and worse in the neo-sabe Iron Age.

Rob is currently tilting windmills over the selection of Clayton Kershaw as the 2011 Cy Young Award winner. He and his former ESPN colleague, Keith Law, seem to have decided that they know best with  respect to which version of WAR (Wins Above Replacement, for those of you still break bread with a Visigothic splinter group...) is the one to apply to the task of ranking Cy Young candidates.

To say that this is a decision made based on factionalism and politics as opposed to any demonstrable technical knowledge on the part of these two is perhaps more bold a statement than we should make, given that these two are now BBWAA members (and, unbeknownst to themselves, have jumped the shark.) But overly bold as it might be, it is the plain and ugly truth.

The plain fact of the matter is that the war over WAR is a pointless one, and the idea that anyone could cite one or the other of the competing formulae as definitive is both insult and injury. Both versions--the one at Forman et fils and the one at Fangraphs--are flawed. Just how flawed is one of the murky embarrassments of the field, because rather than working to clarify the issues involved and possibly leapfrog past the limitations and distortions, we instead have careerist insiders using these tools for their own agendas.

It's ironic that Bill James just wrote an eloquent rejection of the notion of "expertise" as a claim for methodological superiority, only to witness the exact type of behavior he is critiquing rear its head.

It's ironic, but it's not surprising, given the track record of the two men in question. This is what happens when the quest for knowledge gets compromised by careerism.

The idea that Clayton Kershaw's selection as NL CYA is any kind of a blot on the award process, or on sabermetrics, or any similarly phrased journalistic exercise in misdirection, is beyond silly. (We'll address this question in greater detail below.)

Apparently our heroes think that because one version of WAR incorporates BABIP into its calculation and it creates distance between Kershaw and Roy Halladay, this is proof that we have all gone right back down the rabbit hole that we all just climbed out of when Felix Hernandez was awarded the AL CYA last year.

There are a few interesting conceptual problems about BABIP and how it should be adjusted for in a WAR statistic that rarely--if ever--get addressed. The one that seems to elude most of its practitioners is that its slice of pitching statistics is both incomplete and based on half-truths. (For one thing, it's highly ironic that a stat based on batting average has become so pivotal in a field that continues to insist that BA is a woefully inadequate tool.)

Another, possibly more devastating problem is that other slices of pitching performance that may more accurately depict the way in which pitchers prevent run scoring--such as situational pitching--are completely ignored and discarded in the mad rush to a so-called "fielding independent" perspective. Each of these constitutes subsets of data, but one has become inordinately privileged as a result of a series of assumptions that are nowhere near being verified.

On second thought...maybe not.
In the continuing absence of a definitive solution to the war over WAR, there is a need--now more than ever--to revisit other probabilistic modeling methods, particularly for pitching. We've been doing just that here for awhile with the Quality Matrix, which--yes--was invented here so many years ago. Rather than simply sum up and perform adjustments on run prevention, it provides a probabilistic basis for winning percentage by creating a bidirectional performance grid that is tied to actual game results.

What's different in QMAX is its willingness to throw away the runs to get at the probabilities of the combined components that result in runs. Its indirectness is upfront, as opposed to the indirectness in the application of WAR for pitchers, which makes a series of murky assumptions about what the "replacement level" of runs allowed is for each individual pitcher. You will chase your tail in trying to reconcile how those replacement level figures are calculated.

You don't have to bother with that for QMAX, because the runs are removed and probabilistic winning percentages are calculated from the thousands of individual games played in each season. BABIP-based systems really slide over the sample size issues in their calculations, figuring (conveniently) that the details of run-scoring don't really matter--their regression model is supposed to handle it all. There is increasing evidence that it doesn't.

Each of those QMAX cells has hundreds-thousands of games represented, with probabilistic winning percentages that are linear in their descent from the best games (at the top left of the matrix) to the worst (in the lower right). Let's see what QMAX has to say about the 2011 NL CYA.

First we'll look at four QMAX matrix boxes--for Kershaw, Halladay, Halladay's illustrious teammate Cliff Lee, and Ian Kennedy of the Arizona Diamondbacks. These are the four best starting pitchers in the 2011 NL according to QMAX. The other benefit with this tool is that it gives a graphic presentation of the quality pattern of the individual pitcher.

The measurements on the "S" (hit/XB prevention) and "C" (walk prevention) create a "shape" function that can't be found in other pitching statistics. We'll look at the "shape data" for these four pitchers and what it tells us as we go along.

Remembering that the charts depict the best in the upper left and the worst in the lower right, we can see that these four pitchers had very fine years in 2011.

What's clear from the matrix boxes is that Kershaw and Lee had many more games in the very best area of the QMAX chart, the yellow-shaded area that we call the "Elite Square," where 83% of the games in that region wind up as wins for the team whose starter inhabits it.

What's also clear is that Kershaw and Kennedy were both able to avoid getting "hit hard" (the region on the chart that's shown in orange) to a far greater extent than the two Phillies' aces.

These two veterans inhabit what we call the "Tommy John" region of the QMAX chart (the box at the lower left) with much greater frequency than the two younger pitchers. These are games where hits are plentiful, walks are scarce, and runs saved over probabilistic expectation can be achieved.

We can't simply read the QMAX chart to know which of these four had the best season; we need to compile the QMAX range data to see how the candidates compare. The range data creates totals for each of the regions defined on the chart--the aforementioned "Elite Square", the broader "Success Square" (which many folks have already pointed out, thank you, is not quite a square), the counterintuitive regions in the upper right and lower left (the "Tommy John" and "Power Precipice" regions--that last one may be familiar to you from our look at Jonathan Sanchez recently), and the deadly box in the lower right, the "Blown Start" region (not much in play for the four pitchers here).

The range data shows how well these guys really did. "Success Square" percentages in the 60s and 70s; "Elite Square" numbers in the 20s through 40s (Lee had a magnificent run of these games in the second half of 2011 and wound up at 44% in this category, one of the highest totals in recent memory). Kershaw excelled at avoiding "hit hard" games, with only 6%; Kennedy was very good as well (15%), while the two Phils were much closer to league average in this stat.

In terms of top hit prevention games (measured in the top two rows of the QMAX diagram, the ones referred to as "S12"), Kershaw and Lee had excellent percentages, while Halladay and Kennedy were merely above average.


We can rank these for each pitcher relative to the others, assigning points to the relative values: the bright orange worth three points, the pale orange two, and the yellow one. That adds up to what we call the "Quality Range Score" (QRS). It's just a crude indicator, but it might well be suitable for breaking a tie or moving a close contest in one particular direction. Kershaw has the advantage here.

The summary stats for QMAX are the "S" and "C" averages, which add up to a total ("T") ranking. (The lower the "T" score, the better--just like ERA.) By using the probabilistic win percentages or values assigned to each cell in the matrix (these are called QWVs), we can calculate the pitcher's overall quality value, his Quality Winning Percentage (QWP).

Remember, we are pushing back against actual wins and losses here, as represented in the linkage between each performance cell and the historical results in that cell. What is lost by ignoring questions of "fielding independence" is offset by a grounding in both probability and reality.

The result is "abstract," but so is FIP. We can adjust the "T" value to an ERA construct if it makes you feel more at home, but we haven't bothered. What you need to know is that any "T" score below six is an ace, anything below five is an historic season. (Pedro Martinez scored 2.00 "S", 1.90 "C"/3.90 "T" in 2000, which was pretty darned historic.)

What QMAX shows us is a narrow lead for Kershaw in both the "T" score and in the QWP. What it does is reinforce the largely-held impression by intelligent folks (those who are undraped in questionable "expertise" and sportswriterly posturing) that the race between Kershaw, Halladay and Lee was extremely close.

Notice that we are not discussing pitching triple crowns here, or any other stats. QMAX is agnostic concerning strikeouts. Based on the down-at-the-game level probabilities, and without recourse to any of the ideological puffery of a Law or the grandstanding bully pulpit of a Neyer (OK, we're partially guilty on that one...), we figure that it's actually OK to vote for Clayton Kershaw with a (relatively) free conscience. (The relativity has more to do with what else you've been up to.)

We sincerely wish that our two fine feathered "friends" would quit leading us on a wild goose chase. However, it is migration season and the skies are pretty crowded. No one would blame you if you hauled out the shotgun and took aim at the sky. Just don't take aim at our two friends here, who seem to think they are flying high up in the air, but are actually stuck on the ground.

Wednesday, November 16, 2011

THE AWARD YOU DON'T WANT TO WIN

A socio-linguist studying the sabe-centric world might well have a tough time picking out the most prevalent (read: privileged) jargon--what H. L. Mencken (channeling his inner Victor Hugo via Thorstein Veblen) would have dubbed "the argot of the analyst class."

"Sweet Jehosaphat, Ann, every week our relationship regresses
to the mean!!"
There are so many to choose from...

--But let's not dwell upon this, as such a discussion simply revisits the peculiar intractability inherent in the ongoing war over WAR, the guerrilla infighting, the race to phantom regions of moral rectitude, the shameless borrowing of social science concepts for the sake of intellectual carpet-bombing, etc.

Whatever lists of involuted supercalifragilistic expialadociousness are compiled to tourniquet the machinery of the "meme" as it has spread across the little world of baseball analysis during the past three decades, there is one phrase that's almost certain to be at the top. What is it? No, it's not that girl, it's...

Regression to the mean.

Fuggedabout that girl...this girl has got the stuff. While her affinity
for upscale malt liquor is elevated, there's no truth to the rumor that
she'll be naming her new band LoLo and the Suds...but, hey, if
Lauren Hillman keeps writing songs like "Young Love," she can
do whatever she wants....
This is the allspice of sabermetrics, even seems to not eff up the taste of ice cream when you accidentally take off the top and dump instead of sprinkle. Of course, tastes differ, but this explanation of events seems so ladled with preservatives that you can not only leave it on the bedpost overnight, but you can leave it out for decades...aeons...and it won't spoil or--worst of all--get clumpy due to prolonged exposure to the air.

And that's just what we need in a phrase that combines precision and puffery, rigor and mortis, warp and woof.

Now it turns out that there is one post-season award that exemplifies the actual principle within the phrase "regression to the mean." It's an award whose trophy should contain--or possibly simply just be--a double-edged sword.

"Managers of the Year" by Francisco Goya...
What's that award?

It's called Manager of the Year. Today, two fine fellows will get honored for their work in the dugout. Next year, they will almost certainly get buried.

Think I'm off my rocker? (It's OK, national polls favor your position.) Here are the facts: the winning percentage of managers in the years they win the MoYA (rhymes with Goya, so...) is .591. Their winning percentage in the year after is...

.511.

That's an eighty-point drop. Teams win 13.4% fewer games in the season following a year where the manager has been a MoYA.

There have been fifty-four managers who were MoYA and managed again in the next year. (We tossed out Bobby Cox, TOR, 1985, and Davey Johnson, BAL, 1997, because they didn't manage in the following season). Out of this group of fifty-four managers, only four of them (7%) had a better winning percentage in the year after they won the MoYA. Those four managers who've beaten the odds are: Jim Leyland, PIT, 1990; Bobby Cox, ATL, 1991; Gene Lamont, CHW, 1993; and Joe Torre, NYY, 1996.

Everyone else on the list (and it's reproduced for you at left) has, to some degree or another, taken it in the tukus. As is usually the case, Tony LaRussa is prominent on this list, and just might walk off with the record for the longest span of MoYA, having gotten his first in 1983 (and winning 25 fewer games the next year). We all know that Tony is singular, and so it shouldn't be surprising that he is the only manager to win the World Series in the season following a MoYA: 1989. The A's did win fewer games in '89 than in '88, but Tony is, as always, at least a partial anomaly unto himself.

This partially explains why it is so rare for anyone to be MoYA in successive seasons. Over the past twenty-nine years, this has happened only once, when Bobby Cox won in both 2004 and 2005.

Who had the greatest percentage drop from one year to the next? Until the conclusion of the present season, the cruel fact was that the MoYA who crashed hardest was--you guessed it--someone who worked for Kansas City. Tony Pena, who also holds the record for winning a MoYA with the lowest seasonal WPCT (.512, 83-79), watched in Goya-esque horror as his team tumbled into Boschian regions (Don or Hieronymous, take your pick...) the next year, going 58-104. That amounted to a 30.12% drop in WPCT.

As we said, until this year. Ron Gardenhire has taken Pena off the hook with an even more fearsomely prodigious swan dive, one that represents a drop of 32.98%.

Tony LaRussa managed to have two follow-on MoYA disaster years--1984, noted already (a 25% drop) and 1993 (a 29% drop). One suspects that Tony knows all this, and here's yet another reason for him to ride off into the sunset in case the BBWAA hands him another double-edged sword.

Looking from the insider perspective, the one where the folks involved actually put on the jockstrap, there's a phrase that resonates with the concept of "regression to the mean." That phrase, uttered on behalf of Sandy Koufax by the great sportswriter Ed Linn (the ghostwriter of Sandy's 1966 autobiography), goes as follows:

"This game can't wait to humble you."

That apparently applies to managers even more than players.

So congrats to the 2011 MoYA winners [UPDATE: Kirk Gibson and Jumpin' Joe Maddon]--and...

Condolences.