Sunday, December 30, 2012

BALLAD OF AN EX-THIN MAN

Clues and prophecies abounding: the number 61 is signfiyin' the
following...part of the album title in which the song quote at the top of the
article is located, and...the total number of Hall of Fame votes
that will represent the maximum cast for Mr. Andruw Rudolf Jones.
"Something is happening here/But you don't know what it is...

...Do you, Mr. Jones?"

Symptomatic of a wayward career spent in the cantilevered world of high offense, loose women, numbers-oozing fanboys, and a state of blissful obliviousness once thought humanly unreachable, Andruw Jones has left the building in a way that is frighteningly apropos.

Just days after signing a contract to play in Japan, Jones managed to get arrested for spousal battery while passed out from an excess of drink.

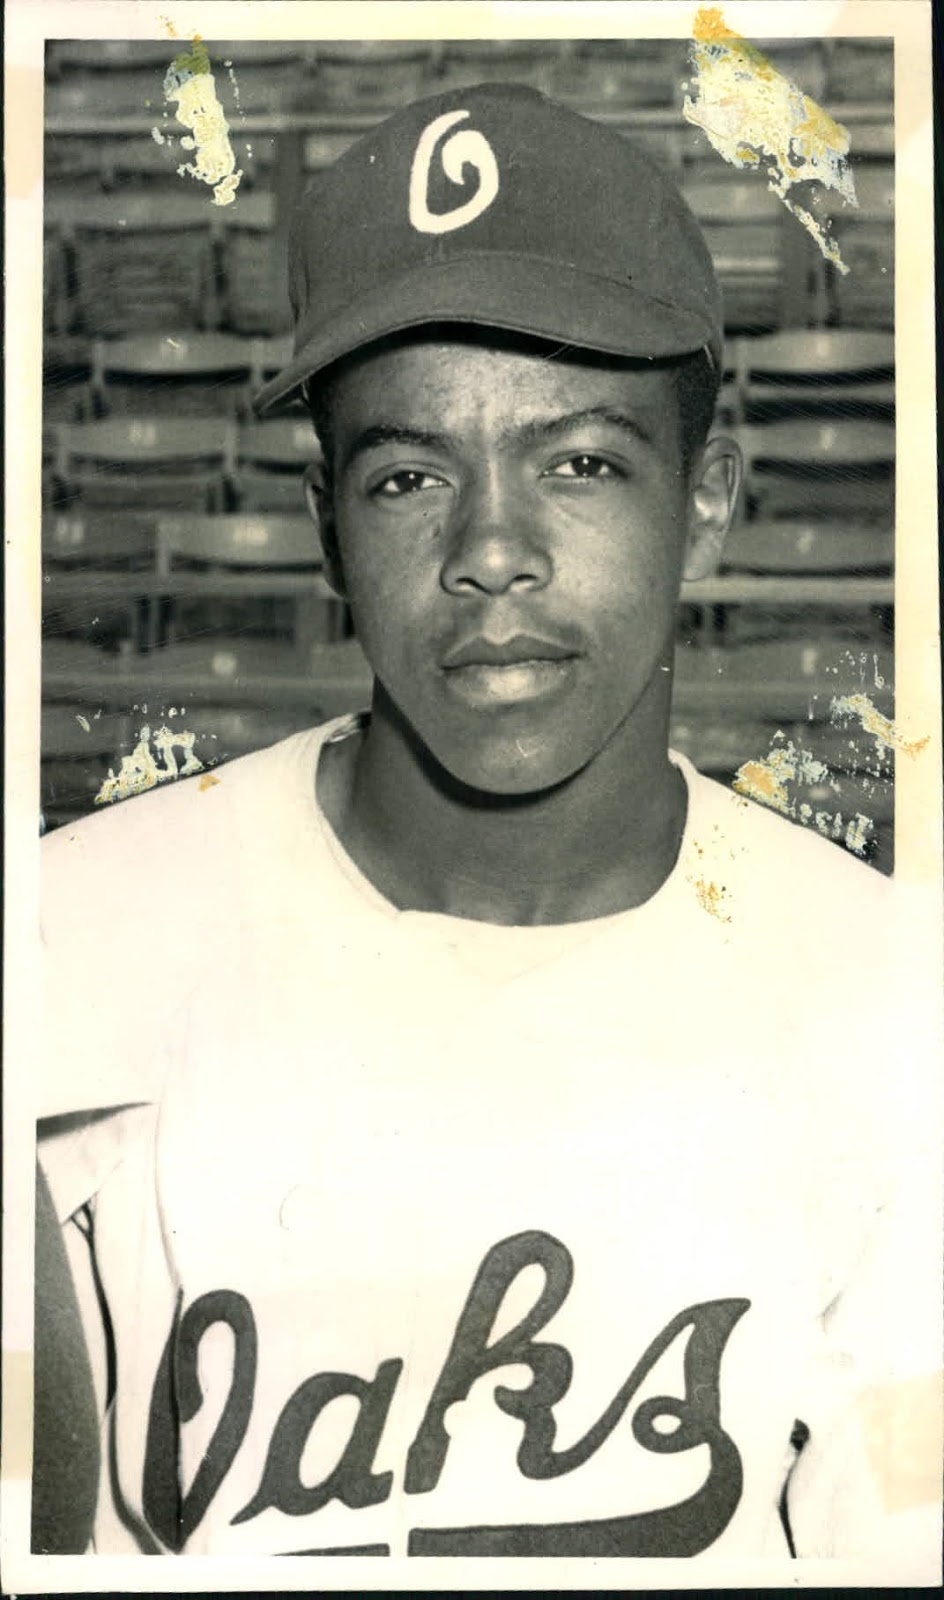
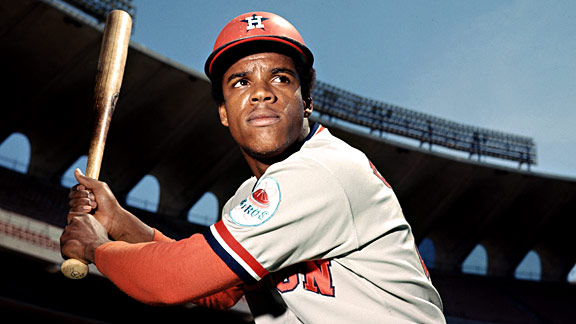
Such a state seems all too on target as a way to characterize Mr. Jones--who, back in the day before he ate his way out of being the next Willie Mays, was alarmingly talented. Fanboys with computers were stroking more than their keyboards when they projected his career (all this, mind you, before the actual coming of a true young God...a natural with a fishier sounding five-letter surname).

They lined up eight to one for Andruw over Vlad Guerrero, and somewhere between 35-40% of 'em will try to invoke their defensive "metrics" to argue for him still.

Contrary to popular belief, Willam Blake never
played for the Mudville Nine; he was front
man for the Four Zoas...
A somewhat smaller percentage will band together to push for his Hall of Fame candidacy.

One of the facts they won't be using will be that Andruw holds a record that, when you examine his career with a steady eye, makes perfect sense for a player who embodies a firm but hazy refutation of William Blake's famous dictum: "The road of excess leads to the palace of wisdom."

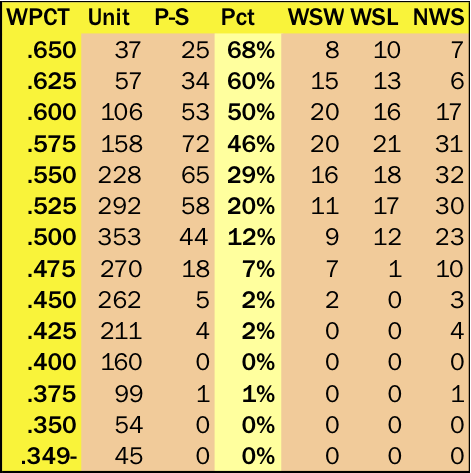
What's that record? Andruw is one of just 26 players who've hit 50 or more homers in a season. (It's happened a total of 42 times.) The average OPS+ for these hitters in the seasons where they hit 50+ HRs is 184.

The highest OPS+ for anyone in such a season is Barry Bonds (259, in 2001).

The lowest OPS+ for anyone in such a season is....

....yes, you guessed it. That red triangle belongs to Mr. Jones, representing a 136 OPS+ for his 51-HR season in 2005.

In the midst of the Dodgers' astonishing spending spree that began last August, it's all too easy to forget that they signed Andruw to a big contract in 2008, despite the clear signals that he'd pretty much eaten all of his talent. The result was a level of decrepitude that literally had to been seen to be believed--and even then, it was unbelievable.

To his credit, Andruw regrouped, summoning up the echoes of his "comatose masher" style of hitting that he'd pushed to its limits in 2005, sleepwalking his way through four more seasons as a platoon player--but that original collapse was so epic that some folks (in dark jest only, of course...) suggested that he was the presagement for the financial catastrophe that followed in the fall of '08.

Assessing Andruw invokes the wry explanations that the man who wrote the words which opened this rueful diatribe gave when asked to explain the song in which they appeared. As was especially the case at the time, Bob Dylan feinted with the panache of Muhammad Ali, and stated:

"This is a song that I wrote a while back in response to people who asked me a whole lot of questions. You just get tired of that every once in a while."

Pressed to name those "people," Dylan rolled one eye, then the other, and replied:

"I saw him come into the room one night and he looked like a camel. He proceeded to put his eyes in his pocket. I asked this guy who he was and he said, 'That's Mr. Jones.' Then I asked this cat, 'Doesn't he do anything but put his eyes in his pocket?'"

Rest assured that the real "next Willie Mays" will not put his eyes in his pocket...he will, in fact, never take his eyes off the ball.

Wednesday, December 26, 2012

BALLPLAYERS BORN ON CHRISTMAS DAY

This is a day late (and I'll let you determine both the value and the type of currency involved in its being short...), but it's too many days to sit on the idea for another go-round...after all, doing so would put into play the 50-50 chance that it would be completely forgotten.

Way back in the posts you'll find a series that dealt with what was called a "Birthyear Showdown." (That's "birthyear," not "birther," by the way.) We did do some simulation for those teams, and were hoping to migrate it into another venue, but those talks trailed off, leaving that in a lingering limbo.

Some of the players on the 12/25 team are as mysterious as the good ol' Shroud
of Turin... where those half-lives can actually help find out how old things are...
if they don't disappear before your very eyes, that is.
When messing with variants of the idea, one that came up was a set based on player's birthdays, but the first-blush reaction was that such would be unlikely to produce teams that could actually be fielded--at least not with resorting to impossibly obscure players with careers no longer than the half-life of highly volatile radioactive substances.

But it's the Christmas season, which means that suspension of disbelief is still ambient in the slipstream, so what better day to dip one's toe into this idea, yes-no, no-yes??

So...here 'tis. The Christmas Day Team. It's unwieldy, but not without its interest.

No bout a doubt it: for this team to have any chance of winning, they
are going to have to give Rickey as much time in the whirlpool as he wants...
For example, there are three Hall of Famers born on Christmas: Rickey Henderson, Pud Galvin, and Nellie Fox.

Alas, in terms of real-life, on-field "chemistry," we are in "Houston-we-have-a-problem" territory...since we will have to play one of baseball's most unrepentant racists, Ben Chapman, next to Henderson in the outfield.

Also, one of the players with a long career (Manny Trillo) is blocked at his natural position by a better player (Fox).

It is a team virtually bereft of home-run power, which gives one pause in terms of setting up the batting order...Rickey Henderson, consummate leadoff man, is easily the best overall hitter on the team and is also by far the team's best power hitter. Where do you bat him?

Here's what we're going to do:
Nellie Fox, trying to decide between smokin' and chewin'...

1. Nellie Fox, 2b
2. Manny Trillo/Walter Holke, 1b
3. Rickey Henderson, lf
4. Ben Chapman, cf
5. Vince Dailey, rf
6. Bill Akers, ss
7. Gene Robertston/Jim Doyle, 3b
8. Gene Lamont/Chris Krug, c

Now raise your hands and tell the truth...how many of you had any recollection of the following names: Holke, Dailey, Akers, Robertson, Doyle, Krug? Gene Lamont you should remember, but as a manager and a coach, not for his brief playing career.

These are obscure journeymen (Holke, highly regarded by John McGraw when he first came to the Giants, but cast aside for, of all people, Hal Chase); AAAA players (Akers, just not quite good enough in the field to hold SS for Tigers in the early 30s); mysterious presences from baseball's misty past (Dailey, still so shrouded in a cloud of unknowing that no one, not even David Nemec, knows which way he batted).

But they're going to have to "make do" and create their own strange stories without the help of Pu Songling, the chronicler of ghost tales from seventeenth-century China who'd be oddly suited to manage this ballclub (regardless of the fact that his only link to baseball is an odd dream that he had late in his life, forced in his slumbers to play a game that was kind of a combination of "celestial town ball" and an odd, sinister variant of the Mesoamerican ball game).

Rounding out the position players on the roster are Joe Quinn (we gotta have a backup SS); Jo-Jo Moore (the player not in the starting lineup with the longest career, as the fourth OF); and Gerry Davis (outfielder was blocked in the Padres system during their brief flowering under Dick Williams: he'd bring some pinch-hitting HR pop that's totally lacking otherwise).

We are going to go with all eleven of the pitchers we've found in the list (which, BTW, can be accessed at Forman et fil) who won't inordinately embarrass themselves:

Ted Lewis, a fine pitcher who went on to finer things...
Right-handed starters: Pud Galvin, Ned Garver, Ted Lewis, Charley Lea, George Haddock
Left-handed starter: Lloyd Brown
Right-handerd relievers: Hideki Okajima, Jack Hamilton, Charlie Beamon, Sr.
Left-handed relievers: Alex Jones, Jeff Little

To have some decent prospects in the bullpen, it might be necessary to make lefty Brown into at least a swingman; this team will have to try some complex patterning for their starters to get an edge (namely trying like hell to get Galvin 40+ starts and doing something similar with Lewis, a genuinely fine hurler lost in the mists of the 1890s offensive explosion).

The 12/25ers should have a decent closer/set-up combo in Okajima and Hamilton, and it will be rather interesting to find a role for Beamon, the least-remembered (as in almost completely forgotten) of the young pitchers who popped up for the Paul Richards Orioles in late 50s. (That this might be due to the fact that he was black is something to ponder--but not to discuss with Ben Chapman).

Young Charlie Beamon, Sr., playing in his
hometown for the Oakland Oaks in 1954...
the A's should honor father and son at the
Boneyard this year.
What makes Beamon into a figure of genuine romance, however, is that his first big league start--which occurred on September 26, 1956--he threw a complete game four-hit shutout against the soon-to-be world champion New York Yankees, winning by a score of 1-0, and beating Whitey Ford to boot. (The only run for the O's came on a wild pitch by Ford.)

The other reason you've never heard of Beamon until now is in his pitching line for that game--while he allowed only four hits, he walked seven over nine innings. He didn't master his control problems, and was quickly lost in the shuffle of the other young pitchers, who were whiter and (at least marginally) less wild. Beamon's son, Charley Jr., was a very solid minor-league hitter who got lost in the glut of the Royals' early farm system riches: he got a brief shot in Seattle in 1977-78, but he didn't hit for power and didn't show much in his small opportunity, and was shuttled off to the other expansion team (the Blue Jays), where he met a similar fate.

I think manager Songling will find a use for the elder Beamon, however. The 12/25ers aren't going to go far in a vast 366-team round robin, but they'll be in the hunt for awhile, we suspect. Now comes the task of deciding whether such an insane project, born from the ingestion of too many sweets on Christmas Day, is worth contemplating. As Pu would say to his charges from his perch in the dugout, however...stranger things have happened.

Monday, December 24, 2012

AGE 21, SPLIT FIVE WAYS FROM BREAKFAST...

OK, let's get down to cases with the age-old question of career progression for young hitters and how more definitive patterns can be discerned from actual data. (Here we follow up on our more flamboyant previous post, where Joe P., re-stating the obvious, indulges in the type of corn-pone exposition that's simultaneously cynical and homespun.)

So here we will try to determine if young player talent levels, as measured by their OPS+ in their very earliest seasons, actually are highly preordained. By this, we mean that young players may already shake out into groups that have readily predictable categorical limits that come into play right from the start.

Bill James suggested a variant of this in the primordial days of his Baseball Abstract when he noted that the younger a player was when he excelled at the game, the longer his career was likely to be. Aside from historical aberrations where some exceptionally young (meaning teen-age) player were brought to the majors (primarily during WWII, with a bit of blip in the sixties), the pivot point for hitters in terms of defining their future career path seems to be located at age 21.

If you make it to the majors and hold your own at that point, you have a strong chance for a long, productive career.

But the level that you achieve at that age--as the chart at left strongly indicates--tends to define a series of segmented, parallel "streams of success" that for the most part remain separated rather strictly according to just how much the hitter dominates against the league at a very early age.

This long, long table displays more than a hundred hitters from 1901 to the present, sorted in descending order of their OPS+ during their age-21 season. What the viewer should be attempting to tease out of this is the frequency in which players in the five OPS+ ranges displayed here (150 OPS+ or higher at age 21, 135-149, 120-134, 110-119, and 109 and below) actually exceed the range they initially set for themselves at that very early point in their careers

(Currently active players are shown in red type.)

What will become evident from studying the players at length (and by examining the summary data for the five ranges that's displayed below the main chart) is that the percentage of improvement is at its greatest among the young players who excel the most, and it declines in a linear fashion across each gradation of quality.

While there are clearly some exceptions (and you're instructed to look across right now at the numbers for Roberto Clemente to see one of the more dramatic anomalies in baseball history), players tend to remain rather tightly slotted across their careers to the level of production they achieve at age 21.

Full disclosure: we've left off about 40 additional players in the lowest grouping, all of these being the players with the worst performance at the age of 21. You see the high preponderance of players whose names appear in bold type at the bottom of the diagram--these are players in the Hall of Fame, and we clustered them in order to see how their patterns looked. As is clear, it's only a few of these players with indifferent performance levels at age 21 who bucked the odds and evolved into Hall of Fame-caliber hitters.

Here are two summaries of the very granular data presented above. First we see how the OPS+ averages progress in each class as we go through several multi-year phases: after age 21, we measure ages 22-24, 25-27, 28-32 and 33-35. We also show the pre-age 21 data when the players have a sufficient number of plate appearances (if they have less than 300 PA in these games, we show that with an asterisk and do not record their OPS+).


The summaries show two things: 1) there are distinct "tracks" that hitters tend to cluster into as a result of their initial level of success, and 2) that the percentage of improvement toward "high peaks" decreases dramatically when the age-21 season is below 120 OPS+.

43% of hitters will show a more pronounced improvement toward a cluster of peak seasons (whether at age 22-24, 25-27, and much less frequently at 28-32) when their age-21 OPS+ is 120 or higher. Only 17% of hitters will show such pronounced improvement when their OPS+ at age 21 is less than 120.

Cesar Cedeno: a false alarm...
So what does this have to do with Joe P. and his ejaculation that young players will perform better as they approach their peak than any group of older players (even "elite" older players? Quite obviously, a good bit. We can see that in adjacent categories from age 21, the 135-149 OPS+ group vs. the 120-134 OPS+ group, that average performance levels for the former remain equal to or a bit higher in the "post-peak" period (ages 28 up) than the levels generated by the latter group in their "pre-peak" (22-24) and "peak" (25-27) periods.

The truly great players (who debut with OPS+ levels of 150 or higher) tend to be the untouchable inner-circle Hall of Famers, sustaining a level of performance even into their later years that isn't approached by any of the other OPS+ ranges. (Of course, there are a few exceptions to that rule: see Cesar Cedeno and Hal Trosky.)

Hal Trosky: felled by injuries
Joe was doubling down on Salvador Perez and Eric Hosmer vs. Josh Hamilton and Albert Pujols. Neither Perez nor Hamilton are part of the study due to the shape of their careers: Perez had less than 200 PAs as a 21-year old, while Hamilton, who was held back for several years due to susbstance abuse issue, didn't make it to the majors until age 26. Hosmer, however, did have a solid age-21 season in 2011 (118 OPS+) before struggling significantly last season.

In a group of hitters where his age-21 season is centered in the population, Hosmer is surrounded by a group of 27 hitters (including himself). OPS+ range: 115-124 for the age 21 year. Out of that group, 7 showed significant improvement. That's just under 26%. While Joe goes with his gut and proclaims that Hosmer will be "a masher," our categorical connection chart indicates that Hosmer has about a 1 in 4 chance of being a breakout hitter.

Now those aren't horrible odds, by any stretch. But unlike hitters such as Giancarlo Stanton or (in semi-recent history) Gary Sheffield, Eric didn't make a step forward during his age-22 season. He's showing difficulty against left-handed pitching. That does tend to make 2013 a pivotal year for him.

Organizing the data in this way actually quantifies the odds of breakout seasons, and takes some of the wish fulfillment away from Joe as he constructs a curious set of prognostications. As we said earlier, there is almost a morbid fascination pervading the cadre of numbers-aligned writers who count the Royals as their home team. That clearly hasn't worked well for them--certainly not in the twenty-first century, which is actually moving well into its teenage years. The response of these writers is analogously adolescent as they reach back for the comfort of Jamesian truisms to salve their wounds of fan identification, when charts such as the one above can assist them in seeing just how likely it is that the scenario they are so devoutly attempting to consummate will actually occur.

Sunday, December 23, 2012

OLD SAWS ABOUT YOUNG PLAYERS

I know...you're going to say: "Jeez, Malcolm, it's Christmas already...just lay off. Have some egg nog. Spike it. Hug that toilet--don't jump into it...again."

And you're right. I mean, who really cares that Joe P., Bill James' raccoon-faced shill, is at it again?

Actually, we all should care.

Joe's recent column, "Youth Will Be Served," serves up watered-down concepts from the Godfather of sabermetrics, and chases that H2O-weakened drink with his usual brazen pusillanimity (and, yes, folks, that is a major-league oxymoron we just trotted out there for you...) while groping toward the type of wish fulfillment that can only come from those who've baked too long in the environs of Royals Stadium.

Joe has mastered the worst aspects of James' practice, and turned it into a parody of the type of analysis that used to be cutting edge, but that's now descending into a crevice of creeping nostalgia.

When James used to pick galvanizing examples for jejune readers back in the 80s, and could graft what surely looked like  a full toupee's worth of evidence to the most oblong-shaped scalp of the mental skinheads reading him, he was genuinely breaking ground. But when Joe tries to do the same thing in 2013, he looks like a guy who has woven a basket around his own dome.

We are, or ought to be, past the point when a two-on-two comparison, cherry-picked for effect, as is the case with Joe's attempt to bring down the house with his young (Staub-Wynn) vs. old (Mays-Mantle) comparison, can stand as evidence.

Cherry-picked? You bet. Joe takes away a year from Mantle by carefully removing his last truly great season (1964) in order to make the WAR numbers work out.

What the actual, proper WAR comparison, using the accurate ages for
the two old superstars,really looks like...
Mantle should be playing in his age-32 season and Mays in his age-33 season in order to match the ages of the two present-day players (Josh Hamilton and Albert Pujols) being used in the comparison.

That means that we should be using 1964 as the starting point for them, instead of the false parallelism of 1965-69 that Joe wants to use.

But when you use 1964, which is the proper year for comparison, Mays and Mantle wind up blowing away Staub and Wynn by about 10 Wins Above Replacement (55.9 vs. 46.6).

It's a real shame that Joe has to stoop to such sleight-of-hand, because the central point he's making is unassailable--and it's been well-known, as noted, for three decades. For Crissakes, Bill was talking about these concepts in his self-published books from the late 70s.

But we are again in an age where the nuances of the past have become the sledgehammers of the present. The uncritical application of Bill's findings about the general placement of peak years and aging patterns has produced a great deal of folly within the little world of sabermetrics over the years--in particular, the notion that teams who simply turn over as much playing time as possible to young players will achieve outsized success.

That idea, in its most extreme manifestation, rose and fell with the 1998-2002 Florida Marlins, whose extreme deployment of players age 25 and under failed to produce a series of post-season appearances for the citizens of Miami or the grand, Teflon-coated prophets at Baseball Prospectus.

Salvador Perez: the hope that dare not speak its name...
"Now, now. Let's be fair...Joe isn't advocating that." Oh, no? He says that if he takes the kids he will win more than if he takes veteran players. These are not facts in evidence from past data.

And by pinning the argument squarely on Eric Hosmer and Salvador Perez, he's clearly in the thrall of the continuing situation vis-a-vis the Royals (his home team). Of course, he's not alone--there is a sizeable knotty-browed "mafia" that's coalesced around this fallen franchise, and they are currently reaching a kind of agitato of anticipation that is featuring the same fervid morbidity and recursive rhetoric that evidenced itself with the fin de siecle Marlins (who, ironically, promptly won a World Series once they were formally written off).

Eric Hosmer: not quite ready for bobble-dom...
It's a crying shame that this point, which has much more to it--and much more to teach us if we would only follow the evidence with more patience and discipline--has been reduced to a mere sound bite. As with so much of what has come out of the field in the past fifteen years, it is shot through with the not-so-subtle bias of the consultancy culture and the entrepreneurial skewing that has afflicted so-called "insider analysis."

We'll come back tomorrow with a series of charts that will take up a good bit more of this ideology disguised as evidence, with data that will recast the argument in surprising ways.

Tuesday, December 18, 2012

QMAX NL 2012 POST-MORTEM: KERSHAW, NOT DICKEY...

Before we embroil everyone in charts and numbers, let's ask one question that doesn't seem to have been asked anywhere in the light of the R.A. Dickey trade:

Here's the proper order of finish for the NL Cy Young according to QMAX...
--Has any other Cy Young winner been traded over the off-season of the year in which he won the award??

We'll let you think about that as we run through the final Quality Matrix (QMAX) data for top vote-getters in the 2012 NL Cy Young Award voting.

We don't recall hearing a lot of noise in the little world of baseball numberologists about the CYA matchup between Dickey and Clayton Kershaw: a couple of years back, it was terribly important that King Felix win the AL Cy--apparently it represented some kind of epistemological breakthrough or something.


...Or something. Kershaw, who won the CYA in 2011, wound up with better numbers than Dickey in every statistical location except two--wins and winning percentage. (It should be noted that one of our long-time faves, Gio Gonzalez, wound up with the most wins, with 21).

But he finished second in the voting, and somehow the world didn't spin off its axis. Well, hell, it's time for us to emulate our "betters" and get uptight, whiny, and intransigent--if only as an hommage to those who apparently shot their wad back in 2010 (or did they just get too caught up in Trout v. Cabrera to "get it up for love"?).

QMAX charts and summary data for the top five finishers are festooned here in the usual places. If you are congenitally forgetful of QMAX (as is pretty much the case for those in the post-DIPS diaspora of highly complex oversimplification...), here's a quick reminder of what this is all about. Hit and walk prevention are placed on a two-dimensional grid; every game gets a grade ("S," for "stuff," measures the hit prevention component; "C," for "command," measures the walk prevention component... "S" has for the past decade added the impact of extra-base hits, the original sore point against the method.) These are added up, averaged, and each game has a probabilistic winning percentage assigned to it based on the actual results over a running five-year period.

The best games (the 1,1 slot on the chart at top left)--produce team wins just under 85% of the time, while the worst games (the 7,7 slot at the bottom right)--produce team wins in just over 12% of the time. When all the math is done, we have the "QMAX Winning Percentage" or QWP, which in our opinion remains the best, most reliable measure of starting pitcher quality out there today.

There are "regions" on the chart (you'll see six) which measure various "shape" and "value" components of performance. QMAX is one of the very few stat measures that manages to measure both. The "success square" is in green (yes, we know it's not a square...); the numbers for it include the interior yellow square (yes, we know that it is a square!) where the very best games are found (we call it the "elite square"). The orange region displays games where the pitcher is "hit hard"--the average number of these games has dropped in the past couple of years, from a high of 36% in 2000 to just over 28% last year.

Oh, yes: like ERA, the "raw" QMAX numbers (the S, C, T data) are better when they're lower.


When we look at the QMAX range data in the above chart (the nine stats at the left...) we see that Kershaw is the leader in the three most important QMAX range stats--success square, elite square, and games in the top hit prevention region (S12). He's also close to the lead in avoiding "hit hard" games (15%, only a bit behind Gonzalez).

When QMAX adds it all up, it's clear that Kershaw was the best starting pitcher in the NL during 2012. Sure, he was better in 2011, when he won the Cy, but we're not in "what have you done for me lately" territory here. Dickey had a fine year and was a great story with his new, hard-edged, "Mount Kilimanjaro" knuckler, but QMAX sez he was #2.

C'mon--get outraged already!! Or are you just waiting for the Hall of Fame results before it's "appropriate" to behave badly??

Answer to the question at the top: Dickey is not the first CYA winner to get traded over the off-season. (Greg Maddux changed teams, but he was a free agent after winning for the Cubs in 1992.)

David Cone: happy to escape the oncoming, seemingly never-ending
slice'n'dice of the "terrible swift sword" as it made mincemeat
of a once-proud, progressive Kansas City Royals franchise...
No, the other pitcher traded after Cy was David Cone, who was sent packing to Toronto just before the start of the 1995 season by the Kansas City Royals. The Royals were apparently annoyed with Cone's visibility during the 1994 player strike. Their "reward" for such transparent retribution has been akin to the "terrible swift sword" scenario which was referenced in "The Battle Hymn of the Republic," but really goes back to the dawn of civilization: since 1995, the Royals have the worst won-loss record in baseball (.425, 1230-1664).

Look out, Mets!!!

Saturday, December 15, 2012

AMELIE'S HOT STREAK

Forget Mike Trout. Ignore Miguel Cabrera. And don't even bother with Buster Posey. The MVP of baseball in 2012 is Amelie Mancini.

That's Most Valuable Printmaker. Amelie has been on an amazing hot streak of late--incredible not just because this "on fire" time has occurred in the off-season.

She's added two new baseball card series to her indescribably charming earlier work. And dare we say it, the newest set--"Curious Second Careers"--is arguably the finest one yet, the most free-form and freewheeling of all (at least thus far).

You can also buy a special box set of the five series. At $150 it may seem pricey, but our gut tells us that it's going to be a terrific investment. But buy sets of cards that you can display, too. Stuff this good shouldn't be sitting around in a safe deposit box, for Crissakes!

And, if only to make this inveterate T-shirt wearer weep tears of joy, she's created a T-shirt line that blows the cards away.

Particularly spectacular are the shirts depicting pitching grips--and, even more particularly, the one with the knuckleball all by itself. (Let's all hope that the Mets get things together with R.A. Dickey so that Amelie and a host of others can proudly wear it to Citi Field in 2013). [EDIT: sad to report, based on news items on 12/16, that it looks like Dickey won't be coming back after all...]


And the Darryl Strawberry shirt, in all its radiant, radical redness, is the perfect combination of sociological edginess and aesthetic esprit de corps.

There is just enough time for those of you who've got baseball folk on your Xmas gift list to get these ordered--go to the Left Field Cards site and do it now!

Just one thing, Amelie. When are you going to start selling those Left Field Cards hangers? Gotta have 'em!!


Tuesday, December 11, 2012

AN ODYSSEY THROUGH THE WORLD OF CLOSE GAMES/5


Let's continue with the historical WPCTs in close games for all post-season teams.

Instead of averaging them, as was done in our last installment, let's look at "scatter charts" for the three categories of post-season teams we'd defined earlier:


1) World Series winners;
2) World Series losers;
3) Non-WS post-season teams.

What we see right away is that one of these isn't like the other two...and it isn't merely because the non-WS post-season teams don't exist prior to 1969.

World Series teams have virtually an identical distribution of close game WPCTs. Over the course of baseball history (or, at least the portion of baseball history that includes the World Series), these teams have been almost evenly matched in every way. Oh, sure, there are differences between WS teams in terms of overall WPCT and WPCT in close games, but these differences have averaged out.

What we see in the emerging history of the post-season,
however, is what appears to be a tendency toward extremes in close game WPCT. I believe that we'd mentioned previously that in 2012 the Orioles' .701 WPCT in close games (again, defined as games decided by two runs or less), which was fourth best all-time, was offset by the Cardinals' .394 WPCT in such contests.

That is a new all-time low for close game WPCT for a playoff team. (That said, we're not going to explore that anomaly right now, baffling as that performance might be.)

The third scatter chart shows a stronger separation in the upper zone. Even the teams with .600-.650 WPCT in close games seem to be increasing--and it's not just a function of extra playoff teams...this trend has emerged over the past decade. (To make this pattern clearer, we've redrawn the third chart to spread its data across the full expanse of the chart. Oh, and we made it bigger, too.)

Now, why would this be happening? (We will assume, at least for now, that this is not just some random variation, even though some might find it imprudent. Our view: it's more likely to be impudent than imprudent, but long-time readers already know that.)

Yes...why. (As Brock Hanke knows, that's always the real question.) Why is more separation in close game WPCT occurring among playoff teams? Why are there more teams making the post-season with better records in close games relative to their overall WPCT?

The reason that makes the most sense, given the particular time frame in which it's occurring, is that the increasing specialization of relief pitcher contains the potential for teams to "steal" extra close-game wins. Managers use more pitchers, but the roles for these pitchers become well-defined around the scenario that privileges the close game; as a result, it's increasingly possible to shepherd such over-reaching performance over the course of an entire season.

Now this, or something closely like it, is what Tango and MGL (those often-noisy prime movers of The Book) have been pulsing through their echo chamber for awhile now. The Tango minions see this bullpen approach as something to expand further, arguing for an even more radical realignment of pitching innings. We tend to think, however, that going further in this direction just might flatten out the type of results that we're seeing in the above chart. Overuse and overexposure of these carefully deployed relievers could produce diminishing returns. What we're looking at is a little seam in the fabric of baseball's system, a skewed result that stems from a very particular application of pitching resources.

There's no way to prove it, of course, until some enterprising manager takes it a step further. The way we see it is that this approach is vexing to neo-sabe conventional wisdom because it is tending to create a class of teams that significantly exceeds their Pythagorean Winning Percentage (PWP) as a result of these strategies. That this might actually be at least a semi-viable approach to team formation is something that's clearly not an acceptable thought balloon, even (and maybe even especially) for those who want to make further cuts in starting pitcher innings. This is the type of anomalous result that is simply not tolerated in the ideologically strictured post-neo world.

Of course, there's another interesting factoid here to consider. These are the teams that don't make it into the World Series after making the post-season. Deploying this strategy might get them into the post-season, but the teams who live by the close game in the regular season have a strong tendency to die in the close game during the post-season. Three prime examples: the 2012 O's, the 2008 Angels, and...the 2002 A's.

That's right. "Moneyball" was actually predicated on exceeding one's Pythagorean by winning close games. And the 2012 A's had a superb run in close games against .500+ teams (28-15: their .651 WPCT in these games was second only to the O's), while their record in close games against sub-.500 teams was only 14-13 (the O's were 27-10 in these type of games).

Since it will be awhile before any team adopts a more aggressive approach to innings usage for relievers, we'll almost certainly have enough time to follow this trend and see if it continues to produce teams excelling in close games. We won't be surprised to discover that it does just that.

Sunday, December 9, 2012

AN ODYSSEY THROUGH THE WORLD OF CLOSE GAMES/4

Let's filter performance in close games into the subset of teams that have made the post-season, and see what we learn about the changes that have occurred over time.

Let's look at just one table of data this time. It's an interesting one. We are comparing the WPCTs in close games for three categories of post-season teams--teams that won the World Series (WSW), teams that lost the World Series (WSL), and teams that made the post-season but didn't make it to the World Series (NWS).


You can pretty much throw a blanket over World Series winners and losers in terms of their WPCTs--whether in close games or overall. Their values--and their percentage differential (in the rightmost section of the chart, highlighted in green)--are virtually identical.

These percentage differentials are neither large nor small in the scheme of things. What's most notable about them, however, is how they've been shrinking over time.

Teams are underperforming in close games relative to their overall WPCT to a markedly lesser extent as the multiple-round post-season has taken hold and expanded. The differential that was in place through 1968 has halved over the past twenty years (1993-2012).

What's happening is that overall WPCTs are falling faster than WPCTs in close games.

We'll look at some detailed "scatter charts" next time around, and see something rather astonishing that's happening in the midst of all this tightening of the difference between WPCTs in close games and overall WPCTs for post-season teams.


Tuesday, December 4, 2012

WE INTERRUPT THIS SERIES: DEACON WHITE IN THE HALL OF FAME (AT LAST)

"...a very quiet man personally inclined to the serious side of life and scarcely one who would be taken for an athlete."

Yes, a quiet man, who would have been right at home in Marvin Miller's MLBPA. The man of few words made them count in 1890, the fateful year of the Players League:

"No man is going to sell my carcass unless I get half."

That would be James Laurie (Deacon) White, one of very early baseball's (as in early 1870s, before there was a National League) greatest players.

White should have been selected in 1939. But, as David Nemec relates in his indispensable Major League Baseball Profiles, 1871-1900, the 91-year-old White was not even invited to the award ceremony.

White played for twenty years, but only amassed 1560 games due to the short schedules that were in play during most of his career. WAR-mongers have tended to give him short shrift, but when we take into account season length, we see that White's WAR/162 is extremely impressive.

It has taken the Hall of Fame 74 years to right one of its original wrongs, but let's not dwell on the negative, shall we? Instead, let's linger on the words of Henry Chadwick, who among his many indelible writings has left us with a memorable portrait of the singular Deacon White:

"[I have never seen] a catcher so quick and expert in his movements behind the bat. His forte is in taking low balls wide of the bat and in capturing difficult foul balls. A cat after a mouse is not quick than James is after a foul ball. As for pluck, he is fearless of the hottest balls, and stands dangerously close to the bat at times."

And he came dangerously close to being left out of the Hall, too. Kudos to the Veterans Committee, which is at last showing signs of coming to its senses.

Monday, December 3, 2012

AN ODYSSEY THROUGH THE WORLD OF CLOSE GAMES/3

Let's move forward into the large-scale historical record for close games and how the winning percentage in that subset is distributed across teams that make the post-season.

Most of you can visualize that the "Unit" column (which means the number of teams at each WPCT threshold) is pretty much a classical bell curve. With over 2300 team-seasons since 1901, this is hardly a surprise. The distribution of post-season teams, however, looks a good bit flatter than the bell curve.

What we'll want to see (eventually...) is whether this distribution is flatter than the one that describes post-season frequency for all games. One of the historical precepts about "great teams" is that they win a lot more non-close games than they do close games; but what's happened over the past fifty years is that there are fewer great teams and there are more teams that make it to the post-season. Competitive balance may be shifting the range of strategies for reaching the post-season.


The chart shows a flattened upper region for post-season teams and their performance in close games, with the big breakpoint coming between .575 (46%) and .550 (29%). The rest of the chart looks pretty classically asymptotic. (It's interesting to note that the first team to reach the post-season while playing less than .400 ball in close games occurred just this past year: the '12 Cards.)

We'll look into the deviation from overall WPCT and WPCT in close games in future installments, but we can look at the shape difference in the descent curve for close game WPCT and overall WPCT.

When we do that, we see that overall WPCT tracks more tightly with "great teams"--but some of this is based on the fact that the first sixty years of this data represents a situation where only pennant winners made it to the post-season.

We get a more encompassing sense of the emerging probabilities in making the post-season in the close game data, with what proves to be much closer to the right side of a bell curve than the steeper decline shown in the overall WPCT data.

It's counterintuitive to say the least, but the close game WPCTs have a bias built in from one-run games, which don't break cleanly in terms of home field advantage. (We covered this phenomenon about ten years ago: one-run games produce a .612 WPCT at home, while all other run differentials produce only a .511 WPCT at home.) That "bias" creates most of the variation in Pythagorean Winning Percentage, and the places where it shows the most difference is a product of how that bias operates. It shouldn't be surprising to discover that the places where the distribution is more closely aligned (in the .550-.600 range) is precisely where we are seeing greater numbers of post-season winning percentages. Over time, with the division structure and an escalating wild card, the two distributions will slowly converge.

What we're going to see (in a future installment) is that the structural changes imposed by division play and wild card seem to creating a new strategic component for making the post-season--namely, by tailoring a ballclub to excel in close games. One of our charts in part 2 (the one displaying the top 25 teams in close game WPCT in inverse chronological order) shows that there's been a clustering of these type of teams in the past decade. We'll look at that in more detail next time.