Tuesday, May 31, 2011

TOP FIVE, TOP TEN AND THE FOLLOWTHROUGH FROM THE FIRST THIRD...

The first third of the 2011 season is just about in the bank as we turn into June, and it struck us that it might be interesting to look at how the standings as of Game 54 resonate in terms of the post-season.

In other words, how many of the teams whose records are in the top five of 54-game winning percentages go on to the playoffs? How many of the teams in the top ten slots wind up in the post-season?

So we collected some data from the years since 1995, when the wildcard team was first invented (actually, it was put into play the year before, but the baseball strike--you remember the baseball strike, don't you?--put the kibosh on it). That data, as displayed in the chart on the left, shows us that nearly three-quarters of the teams whose won-loss records are in the top five over the first third of the season go on to the post-season (73% to be exact).

When we take it down to the top ten, 71% of those teams make the playoffs.

The team that has won the World Series over the past sixteen years has had an average won-loss record in the first third of the season that is just a hair under .600. Only one team (the 2003 Marlins) has posted a sub-.500 record over the first third of the year and gone on to win the Fall Classic.

But there are some other interesting tidbits. Teams that have the best 54-game record but fade away and don't make the post-season (as shown in the column marked "+54, -162") actually play a tad bit better than the eventual World Series winnners during the first third of the year (.603 to .599). Teams that languish in the first third of the season and rebound from that point onward (as shown in the column marked "-54, +162") break out into two distinct groups: those who make the playoffs play a good bit closer to .500 (.463) than those who don't (.414).

So it clearly doesn't pay to fall too far behind in the first third of the season...only the 2009 Rockies and the 2005 Astros had truly rough starts and were able to lift themselves into the playoffs.

All in all, only 19% of teams that played under .500 over the first third of the season in the years from 1995-2010 were able to rally and make it into the playoffs.

What about the rest of the season? How does the "last 108 games" look in terms of this formulation? Well, it's probably not surprising to find out that the level of certainty for teams in the Top Five and Top Ten of WPCT over two-thirds of a season is extremely high.

Teams with a WPCT in the Top Five over the last 108 games make it to the playoffs in just under nine out of ten cases (89% to be exact). Teams in the Top Ten are a bit better (91%). The aggregate winning percentage, however, declines a bit, down to .587--which makes sense given the long haul of the season. We've been on a streak of sub-par performances for World Series winners in this area over the past six years--only one team (the 2009 Yankees) has played really well in the last 108 games.

Conversely, you might wonder what type of indicators are in place when we go down into smaller sample sizes. We took a look at slices of the season at the one-sixth (27 games) and one-ninth levels (18 games). Those results can be seen below.


What we see is that the level of correlation drops a good bit, but it seems to stabilize when it gets down into these smaller slices. Yes, we are going only on one year's worth of data for these, but the aggregate percentage of Top Five and Top Ten teams in any given "sixth" or "ninth" slice seems to stabilize at or around 55%, though the totals do move around a good bit from slice to slice.

There's an interesting little reversal in the WPCT distributions for these slices. 27-game slices tend to tip toward teams that play a bit under .500, while the 18-game slices go the other way. The distributions are not uniform in nature, since the average WPCT in each category isn't necessarily that orderly, but it's still striking that the tilt in each slice is so dramatic between the teams that play .500-.599 ball and those who post WPCTs between .400-.499.

It's interesting to know that a team that makes the Top Five in WPCT over an 18-game period has more than a 50% chance of being a playoff team. We wouldn't necessarily think that to be the case, but there it is. We'll take a look at the teams who fit that definition in 2011 in just a few days from now.

Monday, May 30, 2011

THE BBBA BIRTHYEAR SHOWDOWN 10: 1949

Anatomy of the USA baby boom,
1940-1960
End of the line, as we prepare for the Big Show Down itself, masterminded by a highly valued old crony who wishes to remain anonymous to protect what's left of his reputation. The 1949 squad is highly populated, even though there was a bit of a lull in the "baby boom" birth rate, which had become a virtual straight line in the years immediately following WW II.

Percent of black ballplayers in MLB, 1947-1986
The '49s are also a team with an unusually high preponderance of Afro hair styles, demonstrating the developing link between politics and fashion and the role of the latter in diluting the former. This was also the time when the percentage of black players finally broke through to a plateau where they represented more than twice the actual US population (as shown in the diagram accompanying Mark Armour's SABR essay on major league baseball integration from 1947 to 1986). As a consequence, the 49s have the highest proportion of black players on the roster of any team in the Birthyear Showdown.

Catchers--Ted Simmons, Rick Dempsey, Fred Kendall, Johnny Wockenfuss
First basemen--Cecil Cooper, Mike Hargrove, Andre Thornton, John Mayberry
Second basemen--Bobby Grich, Phil Garner, Lenny Randle
Shortstop--Frank Taveras
Third basemen--Mike Schmidt
Outfielders--Dusty Baker, George Hendrick, Don Baylor, Ben Oglivie, Bake McBride, Garry Maddox, Richie Zisk, Oscar Gamble, Bill Buckner

"Two-thirds of the earth is covered by
water; the other third by Garry Maddox."
OK, OK, we'll play him, despite the
ungodly stack of big sticks in the OF...
Top-heavy with outfielders, to be sure. And it's going to get surreal, because this squad needs to squeeze some more OBP into the lineup by playing Mike Hargrove in left field. That gives us a total of nine outfielders on the roster.

The jam-up of talent in the outfield is about as daunting a proposition as any manager could have to deal with, as the career data chart indicates. The guys in green are really the only ones you can trust to play center field; some of the career defensive numbers in the Sean Smith WAR system seem unduly harsh (George Hendrick's -5.5 leaps out as some kind of anomaly), but it's clear that there's very little advantage to be found in any single configuration of players.

Platooning is the only answer here. We'll go with the following:
Ted "Simba" Simmons

Not aerodynamically sound: Oscar Gamble.
Hargrove and Baker in left;
McBride and Maddox in center;
Oglivie and Zisk in right.

That leaves Baylor, Hendrick and Gamble to come out swinging off the bench.

Elsewhere, things are more cut and dried. You're gonna play Ted Simmons just as much as possible behind the plate, except possibly against the squads with big base stealers (where wise-ass but big-armed Rick Dempsey will get a few chances to do the thing he did best aside from shoot off his mouth).

He made his mark in
Milwaukee: Cecil Cooper.
You're going to platoon Cecil Cooper with Andre Thornton at first, if only due to the fact that A.T. was one of yours truly's very favorite players back in the mid-70s.

Bobby Grich is going to play every game at second base.

So, unfortunately, will be the case with Frank Taveras at short. Trust us, the alternatives among the other SS born in 1949 are even worse.

Mike Schmidt, perfectly balanced at the horizon line...
Michael Jack Schmidt, who used to wear his own red Afro, will bat cleanup for this team in 162 straight games.

So that lineup is going to look something like this (left handed platoon first, then right):

1. McBride cf/Baker lf
2. Hargrove lf/Grich 2b
3. Simmons c
4. Schmidt 3b
5. Cooper/Thornton 1b
6. Oglivie/Zisk rf
7. Grich 2b/Maddox cf
8. Taveras ss

Except for that black hole at SS, this team has some nice pop.

Pity there's no room for Johnny Wockenfuss.

The pitching staff is pretty well balanced and ought to hold up reasonably well. There are no superstars here, but a rotation of Vida Blue, Rick Reuschel, Jerry Reuss, Steve Rogers and some combination as yet to be determined between Mike Caldwell and Rogelio (Roger) Moret seems as though it could hold its own.

Rick "Big Daddy" Reuschel...
...and Al "The Mad Hungarian"
Hrabosky
Naturally, we want to make easy-going, never-saw-a-milk-shake-he-didn't-like Reuschel roommates with the little left-handed relief pitching mountebank and all-around-slice-of-cheese Al Hrabosky. Talk about strange bedfellows.

The rest of the pen features Gary Lavelle, Jim Kern, Steve Foucault and Doug Bair. Some possible control issues for most of these guys, so this just might the team's only real Achilles' heel.

Do I think this team could win it all? Well, just maybe. They have to carry Taveras, but they will score some runs anyway (projected to around 760). They need some fancy pitching out of the top end of their rotation, particularly Vida Blue. I'd be pretty surprised if they came in with less than 85-87 wins.

So just who is Vida Blue talking to, if you catch my drift?
And just what kind of a cigarette is that, Beauregard??
We'll toss together some kind of wild and woolly overall comparison for the ten Birthyear teams (that's "Birthyear," not "birther", for all you Afro-haters out there...) and then we will actually get down to the season, which will start early in June at an accelerated pace, to be reported on across the rest of the 2011 campaign and wrap up in tandem with this year's competish.

Wednesday, May 25, 2011

2011: 11-GAME CHARTS AFTER 44 GAMES

You may remember our earlier look at eleven-game performance data. We thought we'd provide it periodically throughout the current season, and so the chart at the left shows the six baseball divisions in these eleven-game chunks.

At this level of "granularity," there is a fine line between playoff viability, mediocrity, and just plain "badness." The way 2011 is shaping up, a team that could post 6-5 records for fourteen consecutive eleven-game segments would be almost certain to have some kind of shot at the post-season (their 154-game won-loss record under such a scenario: 84-70).

Of course, as the charts for the first four of these eleven-game segments demonstrate, there is only one team who has posted a winning record in all four. That would be the Cleveland Indians.

There are only two teams who've managed to post losing records in all four: the Chicago Cubs (maddeningly consistent at 5-6 in each eleven-game chunk thus far) and the Minnesota Twins.

A distribution chart for these eleven-game segments will show that the Cubs are the poster boys for the slow slide to oblivion, as represented by their four consecutive 5-6 won-loss records.

Almost one-third of all eleven-game performances fall in the 5-6 zone, and in keeping with the bell-curve distribution that one expects from this data set, half of the eleven-game units thus far (60 out of 120) are either 5-6 or 6-5.

There have been 18 instances of a team dominating their opponents over an eleven-game chunk thus far. (We define that as having at least an 8-3 record.) Fourteen teams have done it: Colorado and San Francisco in the NL West; Cincinnati and St. Louis in the NL Central; Atlanta, Florida, and Philadelphia in the NL East; Boston and Tampa Bay in the AL East; Chicago, Cleveland and Detroit in the AL Central; Seattle and Texas in the AL West.

The only teams who've done it more than once thus far in 2011: Boston, Tampa Bay, Cleveland and Cincinnati.

Friday, May 20, 2011

JASON ANSWERS BACK...

Jason Giambi: nothing but "orange juice"... (heh, heh)
Jason Giambi isn't quite ready to ride down the Colorado River in a de-inflatable kayak.

The embattled King of the Instant Weight Room launched three jacks in Philadelphia last night, keeping the slick chicks waiting at river's edge and sending me a not-so-subtle (Giambi? Subtle?? Visualize a flying mallet...) message that he's not ready to relinquish the Rockies' pinch-hitting rocking chair to Matt Stairs.

Yes, it was Kyle Kendrick (he of the hot young wife, who probably has a better fastball than he does...) who served up two of Jason's bombs.

Many folk are discounting Jason's achievement as a result of facing "sub-standard" pitching--but, hey, Kyle didn't serve up the gophers to Carlos Gonzalez, or Troy Tulowitzki, two of Jason's teammates who aren't close to needing a rocking chair.

Jason will always be controversial, but we should celebrate even those folks with "the taint" because they will soon be extinct from the game and folks will lament having to think up new things to moralize about.

Trust me, they will pine for the days of easy scapegoats...

Traipsing through the statistical megaload that Forman et fils make available to us, I am struck by the notion that it might not have been the 'roids that brought Jason (and his In'n'Out fueled physique) to his peak. The chart seems to indicate that Jason's best years coincide with the years where he was able to excel against left-handed pitching.

I don't know about you, but I am not holding my breath for the medical study indicating that steroids create a marked success rate against pitchers of the opposite hand.

Jason probably has a year or two left before he needs to commandeer that kayak. What say that we enjoy him in all his tawdry glory until that time...

...and then Matt Stairs can take his place in the Rockies' rocking chair.

Thursday, May 19, 2011

MEANWHILE, IN JAPAN...

Yu Darvish, in...
The baseball season has begun (first games were postponed until April 12th) amidst the ongoing tension of the Fukushima plant and its continuing vulnerability. For more, check out the ongoing coverage here and here.

...and out of his uniform.
From an American perspective, the biggest news with respect to Japanese pro yakyu remains the likely 2012 arrival of rock-star pitcher Yu Darvish. The 6'5" Darvish is 58-22 over his past four seasons with the Nippon-Ham Fighters of the Japanese Pacific League, and he possesses the alluring, half-Asian/half-Middle Eastern looks to spark all kinds of mayhem in a major American metropolitan area.
Sho Nakata

So far in 2011, Darvish is 5-1 with a 2.20 ERA and is striking out ten batters per nine innings. He'll be 25 in August and just might have enough prime years left to be of significant value in American baseball. Nothing in his prior history suggests that he'll have the type of adjustment issues that have plagued Daisuke Matsusaka during his tenure with the Red Sox.

Nippon-Ham also possesses another likely "impact player" for a future American franchise in Sho Nakata, a 22-year old first baseman who is just starting to come into his own this year.

For ongoing coverage of Japanese baseball in great depth, including box scores, visit the official site of Nippon Professional Baseball.

Wednesday, May 18, 2011

RECLAIMING THE TRIPLE: A SURREALIST PROPOSAL...

John Thorn has thrown down the gauntlet about what we might call the intersection of statistics and aesthetics in baseball--in other words, how the shape of baseball's numbers define the intrinsic set of values that the game displays both to its participants and its observers. It is an issue that is hardly ever addressed, and we should be grateful that baseball's Official Historian is turning his attention to it.

In his recent blog post, "Where Triples Go To Die," John writes beautifully about the nature of early baseball. Even though it is clearly impossible to go back to such a game, Thorn's description of it demonstrates why baseball became so pre-eminent a reflection of American culture:


From its earliest epoch, when a runner could be retired by a thrown ball, baseball was a game defined by its adventurous circuit around the bases. The ancient field games — before bats and balls and other implements came into play — involved chaotic chasing, eluding, and capture. When baseball began it was primarily a game for runners and fielders rather than the batsman or the pitcher. The new game of ball took its name from its hallmark feature: the base, a safe haven symbolizing a bay or harbor amid the perilous homeward course.


"Home runs and candy bars--that's Quinlan's version of baseball...
bloated, bloated, bloated!!"
Thorn then goes on to decry the home run as having so utterly changed the dynamic of the game that he finds baseball to be a lapsed form of its former self, bloated (like Orson Welles in a fat suit in Touch of Evil), literally unrecognizable. And his anguish at the loss of the triple is so palpable that it seems that he's internalized all of the systematic despair chronicled in Robert Burton's The Anatomy of Melancholy.

Of course, the "state of the triple" (which we've touched upon here earlier) has long been a fait accompli, but instead of merely decrying this state of events (a sentiment with which we heartily sympathize), it might be time to look at ways to reclaim the triple in the ongoing context of the game. Why mire ourselves in lamentation when we can dream up a solution to what has been a sixty-year malaise? (We might say the same thing about our country, spending sixty years in a state of polarization as it teeters between the excesses of predatory capitalism and the fragile Eden of a transformed democracy.)

OK, so what can be done? Changing ballparks to reflect a more systematic asymmetry would be a good start. But it may not be enough: in fact, it almost certainly won't be. Baseball needs to figure out a way to literally re-infuse the triple into the game, to find a way to add at least fifty percent more triples. How the hell can that happen?

It's called change the rules. (Politicians do it all the time, of course, and baseball has done more than its share of it in the past, though the dizzying pace of its evolution away from the version that Thorn and others prefer has slowed considerably.) We need to do something completely unorthodox, possibly outright wacky--surreal, even--to reinsert some new wrinkle, a re-invention of that old, lost texture into how the game is played.

A crude depiction of
"The 175 Line"
With that caveat, here goes. To create a set of on-field conditions that simulate an intensely triples-friendly environment, we add a new rule to the game that says that the field manager for each team gets to choose one inning from innings two through six in any contest where the opposition must move one of its outfielders closer to the infield--say, at a line drawn across the field at 175 feet. The other two outfielders must cover the outward ground, which will be opened up considerably and dramatically increase the opportunity for both doubles and triples, depending upon where the ball is hit.

We won't allow managers to call for this configuration in the first inning, because the first inning is the only inning in a game when teams are guaranteed to bat their best hitters in the order designed to produce the most runs. And besides, we want the use of this strategy to inform the context of each game, so that it, too, does not succumb to the perils of uniformity.

And we won't allow the method to be held out for use in the later innings, because that, too, would trend toward a sameness of application that already plagues player usage in the present-day game.

One half-inning like this for each team will add a type of tension that will be palpable both to the players and the fans. It will add a strategic dimension that, literally, has never existed in the game even back in the days when batters could "call their pitch."

How many innings like this would occur where a defensive team managed to keep the opponent from scoring a run? What type of psychological lift would be gained from such an achievement? Well, of course, we don't have any idea. We have to find a way to try out such an idea, even if seems silly or outlandish. We need to test it somehow. And this is not the type of test that can simply be done with regression analyses or modeling, though such techniques might be applied to tell us something about how such a rule change would affect both the shape and the amount of offense.

C'mon, John...smile!!!
No, we need a real-life tryout for this idea, surreal as it might sound. Some things just have to be seen to be evaluated. Baseball could regain some of what Mark Twain called its "drive, and push, and rush, and struggle" with such bold experimentation.

The result of this rule change, based on my back-of-the-envelope calculations, would be to produce at least one more triple per game. Doesn't sound like all that much, but add it up over 2200+ games and the impact of the difference might become clear. That would be a good start, and it just might encourage our melancholy Official Historian to break out into a jig. I will be right there dancing with you, John. [EDIT: For a somewhat lighter side of Thorn, inspect his long and winding quiz.]

Saturday, May 14, 2011

40% OF THE TOP 40: IT HAS A RING TO IT...

Awhile back we showed you the coldest hitters over the past couple of months (with the gimmick in the data being that we were combining April for this year with September from last year).


It's a couple of weeks later, so it's time to turn the tables and look at the top forty hitters (sorted by basic, unadjusted OPS) from September 1st of last year until last night (Friday the thirteenth of May 2011).


You are probably surprised to see two names--Albert Pujols and Jeff Francoeur--in such close proxmity. (That's what small sample sizes can do for you--or is that to you??)

You are probably not all that surprised to see Jose Bautista at the top of this list (though Keith Law might be...not that he'd ever admit it, of course). The full stat breakout here, courtesy of David Pinto's Day-by-Day Database, shows us that only four hitters (Bautista, Matt Holliday, Troy Tulowitzki, and Curtis Granderson) have posted a .600+ SLG over the two month period.

That got us wondering about how well two-month stat samples reflect the performance distribution over a full season. Such a study would involve looking at a series of such samples, then comping them with seasonal data...which is a lengthier task that we have time for today.

So as a substitute for a study of that magnitude, we decided to take a look at the same summarized breakout as shown on the left for the time fame exactly one year earlier (that would be the data from September 1, 2009 until May 14, 2010, shown at right).

These lists are shown for OPS only. What we were looking for here was the distribution of OPS over the Top 40--how many over 1.000, .950, etc. all the way down to .800. That might tell us how different things have become in terms of the "hitting environment" over the last year.

When we look at that, we find that, yes, there are fewer guys at or above .900 (17 in 2010-11 as opposed to 25 in 2009-10).

And we can see how much variability can occur for players. Note Pujols at the left (9/10 until last night), mired in a virtual dead heat with Frenchy Francoeur; then crane your neck to the right and back up to the top of the 9/09-5/10 list, where you'll find him ensconced in the #2 slot behind Joey Votto (the only guy, by the way to be over 1.000 in each of list).

The other thing that's worth noting about this quick and dirty comparison is the number of repeaters--the guys who show up on each list. The total number of repeaters is 16--which means that 40% of the Top 40 are the same guys in each slice.

Now we'll have to go back and do this exercise a bunch more times to determine if such a figure (40%) actually tracks across time. But it would be so nice if it were true, because it has such a nice "ring" to it. "40% of the Top 40 is the same"--sounds like a lyric from some lost psych-pop song. Universal principles should always have a candy-coated surrealist quality to them, n'est-ce pas? (And what a band it was--"Prince Albert and the Morticians"...)

We'll noodle around with this some more and report back on the theoretical efficacy of this freaky little proto-formulation.

Wednesday, May 11, 2011

ADVERSITY, EXTREMITY, OTHERNESS: THE 3 NEW RELIQUARY ETERNALS

Speaking of real and true "great and grand designs"--those born knowingly from the intersection of the spurious and the sublime: the voter population of the Baseball Reliquary has done it again.

Proving that there is no real bad karma associated with the number 13 (this is the baker's dozen year in the Reliquary's Shrine of the Eternals--its ongoing "alternative Hall of Fame" project), the minions of Pasadena's "work small, think big" baseball confabulation have struck more gold in their quest to honor and validate the principles of adversity, extremity and otherness in connection with the National Pastime.

The inductees for 2011: 
Maury Wills

Maury Wills.

Pete Gray.

Ted Giannoulas (aka the "Famous Chicken").

Odd that we wrote about Maury a few months back (a felicitous coincidence--as Reliquary Executive Director Terry Cannon will attest, I've never been a voting member of the organization, though I did threaten long and loud to intercede should Dick Allen continue to languish in the voting results: thankfully for all concerned, he didn't). Wills probably had the best career of any player with such marginal tools, and had the most impact (at least psychologically, if not as measured by now-fashionable value models). 

As is sometimes the case with the SoCal-based Reliquary, they honor local heroes--and Maury, despite his often larger-than-life sense of self, remains a vital symbol of the greatest five-year stretch in Los Angeles Dodger history.

The amazing fielding technique of Pete Gray
Pete Gray clearly exemplifies the Reliquary's threefold cultural formulation--in a way, it's a bit shocking that he didn't get the call from the voters earlier. The amazing Gray was not only one-armed, but a late-bloomer to boot, having to fight long and hard for his chance to play. His dedication in the face of impossible odds is exactly the type of narrative that fits into the Reliquary's wheelhouse, as is his "otherness"--there is no greater haven for the marginalized than in the Shrine of the Eternals.

A Chicken for all seasons, but especially baseball...
Last, but by no means least, one of baseball's greatest comedians, the man who reinvented the concept of the team mascot in what should truly be seen as post-modern terms--Ted Giannoulas is criminally underappreciated for the invention of an alter-ego that literally transcends the milieu in which it was created. The Chicken both lampoons and exalts the entire "fan base" surrounding sports (with baseball, of course, being the richest opportunity for exploitation). Clearly the Chicken is extreme and "other" in ways that literally no one else in baseball can ever hope to be--and Giannoulas himself suffered through a lingering period of adversity, due to protracted lawsuits that threatened his character's right to exist. (Fortunately for us and for our sense of fair play, Ted finally prevailed--with the only downside being that he is much less frequently seen in the context of major league baseball.)

Every year the followers of the Baseball Reliquary wonder whether or not Terry Cannon and his merry band of voters can continue to create a uniquely resonant trio of Eternals. And every year, despite what seems to be mounting odds, they step up to the plate with the bases loaded, two outs in the last of the ninth, down three runs--and sock the ball out of the park. 

They've done it again.

Mark your calendars: July 17th is Shrine of the Eternals Day in Pasadena. The "Hall of Fame for the rest of us" will come to order in its anarchic, unprepossessing way, and (as I've said elsewhere) baseball gold will be spun out of thin air. Don't miss it.

Tuesday, May 10, 2011

DEREK, NATE AND THE BREAKFAST OF CHUMPIONS

"Nice tie, Derek..."
"Thanks, Nate. No, you can't borrow it.
Do those glasses help you pick up
chicks??"
 
It's official. Nate Silver is the Derek Jeter of pundits. The linkage was established once and for all just the other day, waiting only for the Wheaties box where the two of them, with their equally calibrated grins, can both be giving it to the rest of us from somewhere within that slightly unfocused glaze. A new word comes to into being as a result of this unlikely but (let's face it) inevitable union--"chumpions": n., the rest of us who aspire to a carefully-manicured excellence exemplified by a fortunate few whose output is less than the sum of its parts.

Nate's life and career has spiked while riding a wave of euphoria following the election of Barack Obama due to his refashioning of the ever-dubious, ever-proprietary PECOTA projection system into a "meta-polling" engine that sifted through the chaos of competing information massagers in 2008 and delivered a soothing message to that portion of the electorate scared sh*tless by the prospect of Sarah Palin (full disclosure: even I was so relieved by the 2008 election results that I sent Nate a fan note, as if he were somehow responsible for the outcome).

"Proof" of the midwestern conspiracy in 
sabermetrics: Bill Pecota propped up by a mysterious, 
never-identified go-between known only by the
secret handle "Error Bars"....
So Nate leapfrogged from baseball to politics, following roughly in the footsteps of Keith Olbermann (a man noted for taking one or two data points that actually pan out into an isolated outcome and proclaiming it as a "great and grand design") and he's ensconced in the tight little world of carefully calibrated punditry. It appears that he wants to be some combination of Walter Lippmann, Tony Schwartz, George Gallup, and Ronald Faucheux. (For those not steeped in any/all of these individuals, that would be an above-it-all political pundit with vague progressive tendencies merged with an erstwhile media visionary, crossed with a numbers-wonk who writes an ever-changing how-to manual in his spare time.)

Oddly, that is virtually the perfect analogue for a slick, curiously charismatic, self-involved, good-hitting shortstop whose Hall-of-Fame career is inordinately boosted by his association with the Most Storied Franchise in Baseball History™ and whose deficiencies (mostly defensive in nature) have created a groundswell amongst a segment of the population who, like their political brethren, have seized upon the instruments of polarizing rhetoric and now regularly spew hateful invective at all turns.

Never so easy to think small as when you 
start thinkin' big...or is that verse-vica??

Nate, like Derek, has zoomed up to a level of acclaim that is more than a bit inordinate, and the level of intricate inwardness that both men are now conjuring up in their respective situations has got to be a good bit more than roughly analogous. That phrase, by the way--"roughly analogous"--is the jumping off point for all of Nate's work, beginning with PECOTA and moving onward into the ooze of his uniquely recursive, self-insulating projections, just as Jeter's symbolism as the Latest In The Line of Iconic Yankee Superstars™ has become its own lightning rod for the world as defined in the famous New Yorker cartoon and the rest of us.

So it was a momentous bit of anti-climax when Nate decided to step out of the political portal and feed the Baseball Beast, given that the anti-Jeter crowd, buoyed by the Yankees' inability to part company with an aging superstar, has been especially vigilant given Derek's dominoing performance levels since last July.

But apparently Nate didn't want to spend too much time on it (after all, he's above it all now), so he tossed together a piece that, when you remove the rather silly numerical projection and the factual error, reads an awful lot like one of his meta-polling, neo-objective pieces of pale-hosed punditry.

Presumably the pre-2008 Nate would have known that Jeter could not score so few as 59 runs in 131 games without being moved down in the Yankees' batting order (leadoff men score the most, even though they are usually the fourth-best overall hitter on their team), but the 2011 Nate didn't see fit to reference this wrinkle. Clearly the pre-2008 Nate would have taken the time to determine that Derek did not, in fact, have a slow start in 2010 (he hit .330 in April last year). The 2011 Nate probably thought he remembered that fact, and found it congenial to his "throw a bone in each direction" strategic approach to framing an argument that has become so ingrained into his writing that one suspects he has concocted a "meta-template" for how his essays are constructed. Indeed, it's possible that Nate has actually managed to automate the process and isn't actually "writing" them himself anymore!

"Hey Nate! This one's for you. The next one's for me. (Oh, by the
way, the first one was for me too. Sorry.) Love, Derek."
Naturally enough, on the very next day, Jeter found a way to remind us that all of our projections--whether they are based on post-modern algorithms or simply on the time-old hunches and back-of-the-envelope scratchings by folks with barely a working knowledge of a spreadsheet--can be reduced to dust in the twinkle of an eye (or in two swings of a bat). Derek, who'd been showing a faint pulse in the preceding few games, suddenly discovered a power stroke that had been hibernating since the summer of 2010 and slammed two homers en route to a 4-for-6 day as the Yankees knocked off the Texas Rangers (the team that knocked them out of the playoffs in 2010), 12-5.

Projection systems are fun--they're the part of the "sabermetric" enterprise that captures the largest segment of the mainstream audience because everyone wants to speculate about the future. (That's why political pundits are so popular.) The problem, of course, is that the "neo-sabe" movement, in their careerist agendas, decided to upscale and proprietarize (always wanted to coin that word!!) their tools. It seems a bit unfair that they get to have their cake and eat it, since the tools aren't really all that good and they have taken care to insulate themselves against the distance between prediction and reality. In short, they've become just another facet of the "expert class," a parasitic coterie of modern culture that, like the .500 pitcher, always seems better at what they do than they really are, because once in awhile, like Nate Silver in 2008, they seem to be right at just the right time.

But as my dear old departed Dad was so fond of saying: "Who said anything about being fair?" Nate (and some of you) might not think that I'm being fair, but in this instance I feel compelled to insist:

--You first!!

And don't forget to eat your Wheaties (whilst so many others are eating the evidence)...

Friday, May 6, 2011

SAY HEY!

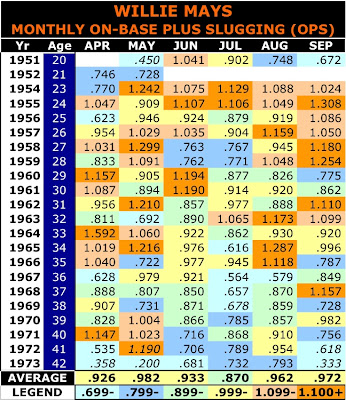
Willie Mays is 80 today, and we thought it would be fun to break out his career stats in a way that probably hasn't been seen before.

We'll never know if Willie might have gotten to Babe Ruth's home run record (Ruth? Home run record?? Anyone remember that???) had he not missed time in 1952 and 1953 due to military service, but many folks still think of him as the greatest all-around player they ever saw--the rough lineage of this concept probably being Honus Wagner-Ty Cobb-Babe Ruth-Joe DiMaggio-Willie Mays: and then we are into the limbo of an overspecialized game where no one player could embody the attributes that could mean all things to all men.

The chart below summarizes Willie's monthly "hitting pulse" across his career, and we've color-coded it to show "hot" and "cold" a la the au courant "heat charts" which have proliferated across many "advanced metrics" sites like hyperactively horny rabbits--and that often make you think you're experiencing a combination acid flashback and Rorschach test.

There are 127 months represented, and the distribution of Mays' performance in these monthly rectangles is interestingly linear/regular. There are 22 months where he was ultra hot (1.100+ OPS); 21 where he was hot (1.000-1.099 OPS); 26 where he was simply his own self (.900-.999), 22 where he was merely a very good major league player (.800-.899); 21 where he was in a mild funk (.700-.799, which is still in the range of "league average"); and 15 where he was cold to very cold (.699 OPS and below).

(The data values in italics are months where Willie had less than 50 plate appearances.)

The notion that hitters peak at a young age is reinforced by this chart. (Though, yes, to make this more accurate, we need league-adjusted OPS to counteract the effects of the offensive decline in 1963-68). From 1954-59, Mays' months are ultra hot or hot twenty times out of a possible thirty-six, or 56% of the time. And by strapping together months across years, we can see that Willie was playing exceptionally well across the last half of 1963 and the first half of 1964, putting together five straight months in the "orange zone" (matching his feat in 1954). [EDIT: Using David Pinto's Day-By-Day Database, we can see that Willie hit .362 during this time frame, with 42 HRs in 123 games. That's a .722 SLG and an OPS of 1.143.]

Looking at the data vertically, we can see that Willie just seemed to have a swoon in July (a month later than the infamous "June swoon" so often referred to by Giants fans as a feature of team's performance: we'll look at that sometime and see if it is truth or fiction). Distribution of "ultra" and "hot" months as actual months goes like this: April 8, May 9, June 7, July 3, August 7, September 9. Distribution of "funk" and "cold/frigid" months: April 5, May 5, June 5, July 8, August 3, September 5 (not counting months with less than 50 PAs).

The average OPS values show that Willie was at his best in May, took a dip in the middle of the year, and found a "second wind" in time for the stretch drive. One exception to that can be seen in 1971, when the 40-year old Mays was sizzling at the start of the year to help the Giants into a big early lead, and both he and they coasted into the playoffs.

One final comparison might pinpoint when Willie's downward turn occurred. The first three months of 1956 and 1967 look awfully similar (though, again, we need league-adjusted OPS for best accuracy). In July of '67, however, it looks as though Willie hit the wall. When you look at the full chart again in light of this comparison, you can sense in the color-coding from that point downward a vivid visual representation of what analysts like to call a "decline phase."

Happy birthday, Willie, and thanks for the memories.

Thursday, May 5, 2011

ASCENDING THE STAIRS

Matt Stairs has 23 lifetime regular-season pinch-hit homers. This is
his 24th, hit in Game 4 of the 2008 NL Championship Series...
Matt Stairs collected his one hundredth pinch hit last night, which is notable in several ways:

--He went twelve seasons between his first season with 10+ pinch-hits (1997, 12-for-34) and his second (2009, 13-for-63).

--He has, oddly enough, been in a long "slump" as a pinch-hitter after one of the more electrifying runs in what is arguably the game's most challenging capacity (since 1999, Stairs is .225/.355/.467 in pinch-hit appearances as opposed to .372/.443/.605 from 1992-98).

Despite that odd little (small sample! small sample!) split in his PH data, Stairs is still a major anomaly in that he's hit better coming off the bench (.863 OPS) than when he's started (.836 OPS). Given that the average pinch-hitter gives away between 20-25% of the overall league OPS whenever they come off the bench, Matt's achievement is nothing more or less than remarkable.

Thanks to Forman and company, we can all take a gander at every single one of Matt's pinch-hitting appearances. We can also look at each of his 23 pinch-hit homers (of which, interestingly, 15 have been hit on the road). And we can see that out of Stairs' 100 pinch-hits, exactly one (and one only) has come off a left-handed pitcher. (He's 1-for-26 lifetime as a pinch-hitter against lefties.)

In an earlier era, Stairs might have pinch-hit even more often. His first three years in Oakland (1997-99), when the A's were actually following first-generation sabermetric concepts, set the stage for his career as a starting player; back in the 70s/80s, it is possible that he might have been moved to pinch-hitting more quickly, and his success in the role might have pushed his lifetime pinch-hit plate appearances toward 1,000--which would have been an equally interesting alternative for us to be pondering.
Maine man Stairs began his career
just over the border, before the Expos
were hijacked by Bud and his kronies...

Just follow that slinky chick down the
river, Jason, so we can make room
for Matt as the bench bat in Coors...
It's a bit odd that Matt had never been re-signed by any of the teams who had retained his services over his career--until his "indirect" return to the franchise that first brought him up to the majors (remember the Montreal Expos? They are the skeleton still rattling in the closet of the Washington Nationals).

Where Stairs really needs to play, however, is Coors Field. The Rockies should send Jason Giambi down the Colorado River in a de-inflatable kayak and sign up Matt, whose lifetime record in Coors is 16-for-40 with six home runs. That works out to a .900 SLG, a 1.400 OPS. Think that might be good off the bench?

Let's hope Matt can hang around for a few more years...baseball needs anomalies more than ever, as we try to survive the oncoming swan dive of the most cynical, self-serving Commissioner in the history of the game. Distract us, Matt!!--help us pay no attention to the used-car salesman behind the screen...

Tuesday, May 3, 2011

GOING TRIBAL: CONTEXTUALIZING CLEVELAND

The Cleveland Indians are off to the races, with a 19-8 April in the bank and a not-inconsiderable amount of buzz developing around their unexpected fast start. Let's spend a few moments breaking this down in order to determine how things might turn out for them in 2011.

Josh Tomlin
Justin Masterson
When we look at the team's stats, two unusual features emerge. First, the Indians have two young pitchers, Justin Masterson and Josh Tomlin, who are both off to exceptionally hot starts (Masterson is 5-0, Tomlin 4-0). Both are sporting ERAs that are about half of what they were in 2010. Those sometimes flammable "advanced metrics" suggest that Masterson is pitching just a bit better than last year, when mediocre run support and some trouble with control and keeping the ball in the yard kept his ERA in the 4.50 region.

Tomlin's prognosis is, if anything, less rosy given that he sports a batting average on balls in play (BABIP) of .179, which is in post-neo parlance so low as to not have a pulse. (And yes, a number that low is clearly unsustainable.) Other new measures suggest that Tomlin has done a Houdini act in high leverage situations thus far in 2011.

"Pronk" (Travis Hafner) has been more Mule
than donkey this year...
Whatever else may be the case for these two, the most undeniable fact is that both men have received excellent run support from the Indians in 2011: in the measure that we prefer over all the others, the 5+% (percentage of starts where the team scores five or more runs), both are well over 50%, which puts them in the top 20% of starting pitchers thus far this season.

The Indians hitters have also compiled a highly unusual "run shape" for their offense: it's spread across the entire batting order in such a way that the #9 slot has scored almost as many runs as the #1 slot. That's actually an amazing achievement for what amounts to one-sixth of the season: it doesn't tend to happen more than about 20% of the time in that sample size, and it happens about seventh-tenths of one percent of the time over an entire season.

This suggests that they are likely to stop being so hyper-efficient sooner than later. On the other hand, they have a fine base of youngish hitters (Carlos Santana, Shin-Soo Choo, Matt LaPorta) and are having resurgent years from Grady Sizemore and Travis Hafner. They should remain a reasonably potent offense.

"Even though you hate me, you adore me as well...and
I can dance so fast that you won't even see me!"
No pronouncements for the future a la neo-sabe Nijinsky Dave Cameron, but it is instructive to at least take a look at the historical record regarding teams who start 19-8 or better over the course of the first 27 games of the year. BB-ref provides us with the breakout, which shows that since 1901, 129 teams have managed to do that. Of those teams, 73 (57%) have gone on to the post-season.

We've broken that data out in two ways--by basic won-loss record and by the Pythagorean won-loss record. The basic W-L (27g record data at the bottom) is all over the map, but the Pythag (at the top) is nicely linear, showing that the more legit you are in terms of runs scored/runs allowed in the one-sixth season slice, the more likely you are to wind up in the post-season.

The Indians, whose current Pythagorean WPCT is .671, score a 53% shot via won-loss, and a 64% shot via Pythagorean.

So don't take them to the bank, but be virtually assured that they are going to be at least a .500+ team in 2011. Only 2% of teams who started 19-8 or better (3 out of 129) wound up below .500 at season's end. And only two of the 69 teams that started exactly 19-8 (3%) failed to post a winning season.