Monday, February 28, 2011

THE DUKE IS DEAD, LONG LIVE THE DUKE

A fact that doesn't seem to get much traction: the great Duke Snider, who passed away last week, hit more home runs than any other ballplayer during the 1950s, with 326. This despite being uprooted from a cozy home park in Brooklyn and plopped down in a ballpark with a 420-foot power alley in right field (the Los Angeles Memorial Coliseum).

Snider is clearly a poster boy for the concept of "peak" performance as a ticket into the Hall of Fame. There is probably no player whose mid-career home park shift was so severe, but the BBWAA voters (at least implicitly) recognized this when they inducted him in 1980. (They also waited until the enshrinement of both Mickey Mantle and Willie Mays, those "other New York center fielders" from "The Era" when the Big Apple owned baseball--a team from New York appeared in ten of eleven post-seasons from 1947-57 and represented both leagues in seven World Series during that time frame.)

So what happened to Snider? A look at the daily data points to two things: the Coliseum, of course, which forced Duke to change his approach at the plate; and a set of nagging injuries that caused him to age prematurely.

In 1958, the Dodgers sure weren't ready to make the move to Los Angeles. The team lost 21 of its first 31 games, and manager Walt Alston was juggling players and lineups at an accelerated rate (the '56 Dodgers had used only 46 different lineups; the '58 team would use 96.)

Snider didn't even start out the year playing center field. He and Gino Cimoli (who, coincidentally, also passed away this month) were flip-flopped by Alston. Snider hit a home run at Seals Stadium in the second game of the 1958 season--and didn't hit another one until May 31st. He found his stroke in June, but regressed in July, still tinkering with his swing at the Coliseum. He seemed to put it all together in August, but suffered through nagging injuries until he twisted his knee while running the bases in mid-September.

What might be shocking to us now is to see how swiftly the Dodgers began to platoon the Duke. The injury-plagued '58 campaign, in which he's missing about forty percent of his usual plate appearances, masks the fact that the switch in ballparks resulted in a reversal of strategy for the Dodgers' opponents. In 1957, left-handed pitchers had made only 6 starts against the Dodgers. In 1958, that total was 25. By 1961, it was 35. While this was still at the bottom of the NL, the 1960 Dodgers had five times as many plate appearances against left-handed starters than the 1957 team.

Snider had hit lefties pretty well up through 1955 (.274/.334/.456), but he backslid in '56 and the Dodgers just didn't see any lefties in '57. It seems as though Alston was really quick to pull the plug: today, a guy with Snider's 1958 profile (age 31, coming off five consecutive 40+ HR seasons) would be pulling down an eight-figure salary, and the chances of such a player being sat down against lefties would be zero.

In 1960, between the platooning and a new rash of injuries, Snider missed half a season. In the seventh game of the 1961 season, Snider was hit by a pitch and suffered a hand injury. He missed a month, and hit just .200 over the next two months, with people speculating that he was through. From late July to the end of the year, Duke hit .369 and slugged .738, trying to lift the Dodgers back into the pennant race.

When you add Duke's '60 and '61 numbers together, you get a full season. It looks like a lesser year from a superstar (136 OPS+, .541 SLG, 30 HR), but the problem is that it's actually two years.

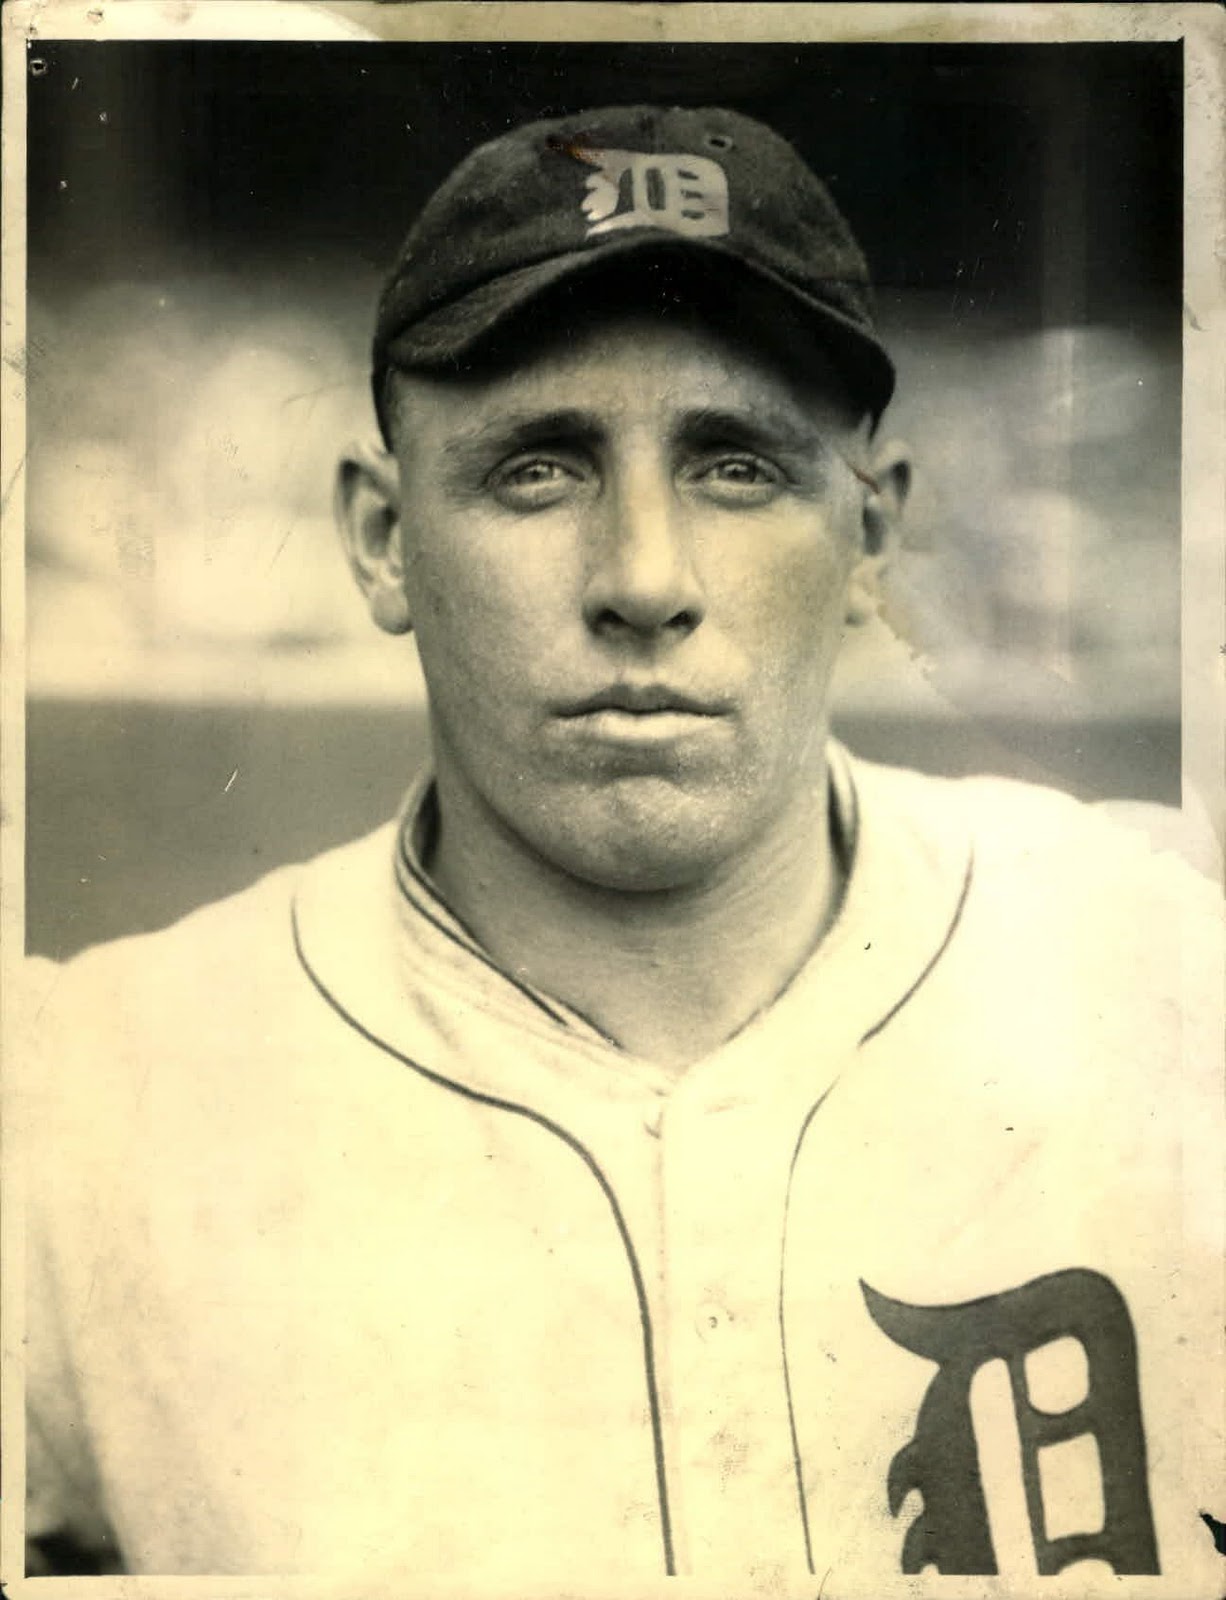
Maybe it was the grey hair that started to appear even before Duke turned 30. Who knows? Snider simply couldn't sustain a full season of baseball once the Dodgers moved west. In the picture above (snapped in September 1961), Snider, 34 at the time, looks older than that.

In 1962, a most curious thing happened. Despite getting off to a hot start, Snider found himself riding the bench in favor of a hot young outfield (Tommy Davis, Willie Davis, Frank Howard). For more than two months, he did nothing but pinch-hit. From June 24th to August 15th, Duke had just 18 plate appearances, going 1-for-14 in that stretch. Of course, the Dodgers were winning, so how could anyone complain? But a 35-year-old player just a tad under his "superstar" level was just wasting away.

In mid-August, Leo Durocher sounded off to a local pundit about the Dodgers. He thought that several veteran players weren't being used properly. This didn't endear Leo to Walt Alston, but it's not coincidental that Snider returned to the lineup shortly thereafter: the Dodgers also tried to fill their offensive sinkhole at third base by moving Tommy Davis to the hot corner, where he'd been error-prone previously. (Tommy was nothing if not consistent--his fielding average at third base in 1962: .889.)

The Dodgers won seven of the first nine games that Duke started, but Snider was too rusty to get into a serious groove. Alston continued with a complex platoon in September, with Duke playing left field against righties (he had all of seven plate appearances against lefties in '62). The Dodgers lost seven of their last nine to wind up in a tie with the Giants. Snider did his part in the playoffs, doubling in the sixth inning of the second game to ignite the Dodgers' seven-run rally (though the big double in that frame was Lee Walls' bases-clearing shot to the left center field wall).

Snider's last at-bat for the Dodgers came in the bottom of the sixth inning in Game Three. He singled and scored the run that moved L.A. ahead 3-2. That was his last hit as a Dodger: he was removed for a defensive replacement in the top of the seventh (one of Alston's over-maneuvers). When the bottom of the ninth came around with the Dodgers trailing 6-4, Snider wasn't available: .205-hitting Larry Burright made the last out of the Dodgers' '62 season.

Duke was sold to the Mets just as the 1963 season started. The Dodgers won the pennant without him--their first since 1941. Snider pushed his career HR total over 400--which, at the time, placed him tenth on the all-time list. Today, he's tied for 46th place with Andruw Jones.

From 1953-57, Snider (161 OPS+) was about as good as anyone not named Williams or Mantle or Mays. It's that peak for which he's remembered, and it's why he's in the Hall of Fame.

Friday, February 25, 2011

WHAT THE LAST FIFTEEN YEARS HAVE DONE TO THE RECORD BOOK

Some years back, for a series in BBBA 1996, I pulled together some data on the "frequency of statistical achievements" for hitters--something that was supposed to run, I think, as part of our "offensive explosion" discussions. It didn't make the cut, but I found it the other day, and realized that if we updated it to 2010 and compared the distributions, we just might find out what the impact of the now-waning "explosion" period had on the record book.

And we might just find a way to adjust some of our perceptions about that period accordingly.

The following counting stats were compiled for 1876-1995 and for 1876-2010: runs scored, hits, doubles, triples, home runs, total bases, runs batted in, bases on balls, extra base hits.

The following derived stats were compiled: batting average, on-base percentage, slugging average, on-base plus slugging, runs creates, isolated power.

These are frequency distributions; that is, the number of times someone has reached a particular number in the statistical categories. Lets use home runs as the example, since it's the "big ticket" item in more senses than one. Looking at the chart, we see that the number of 40+ homer seasons has nearly doubled since 1995 (the ∆ column measures the change as a value comparing the 2010 frequency to 1995's, which was set at 100).

Of course, this chart tells you what you already know: that the home run dominated the past fifteen years and hitters completely rewrote the record book at all thresholds. But you may not have seen the data presented in exactly this way before.

What we'll do now is look at four groupings of these stats based on the amount of change to the frequency distributions that occurred. We are mixing together the counting and the derived stats here, and that mixture will make for an interesting depiction of the shape of the changes that occurred as a result of how the game was played over the past fifteen years.

The low change group, in keeping with what we know as the distinguishing feature of the 1995-2010 time frame--the rise of isolated power as a result of the home run explosion, is not all that surprising: batting average, triples, hits, and runs scored (the distribution of runs scored throughout the batting order has shifted subtly, and has served to dampen the level of change for individual players).

The assault on the hits record, of course, cuts against the grain but is really due to the presence of Ichiro Suzuki, a clear throwback to a type of player and a style of play that was still flourishing in the early 90s. It's interesting how many people, including numbers types who have their ideological subconscious firmly joined to the more uniform style of play as it relates to theories of offense and the concept of "efficiency" as it is now being applied to the game, are fascinated by Ichiro. Perhaps it's because when they watch him,  they sense that there's something about baseball that is otherwise absent from the game.

The upper echelons of the other stats seem impervious to any assault at this point, due to the increasing uniformity of hitting styles over the past fifteen years.
There is a fifth member of the low change group that's a bit surprising, however: on-base percentage. Despite Barry Bonds's rewrite of the OBP record, the overall change profile here is relatively weak. Given that batting average has been deemphasized, it's perhaps not surprising that there are proportionately fewer high-walk, high-batting average types to be found. The shape of the current offensive explosion seems to exclude them.

The moderate change group reflects this lag in OBP, and shows that the offensive explosion in the last fifteen years stemmed a bit more from hitters figuring out how to hit the ball far and get extra bases on their hits. (It seems to be easier to get everyone to do this, hence the increasing uniformity.) The moderate change stats: base on balls, on-base-plus-slugging, and slugging average.

If you think about it, it makes sense that SLG by itself hasn't gone through the roof. High SLG requires high batting average or a massive infusion of extra-base hits as a percentage of total hits. The former drove the records set in the 20s and 30s; the latter drove the overall increase in isolated power that occurred over the past fifteen years, but doesn't necessarily translate into high SLG seasons for individuals. Coupled with the lag in BB, that also tends to dampen the effect on OPS.

The pronounced change group makes for an interesting linkage that could ruffle some feathers in the numbers world. The three stats in this group are runs created, total bases, and runs batted in. Ah, but aren't RBIs supposed to meaningless outside of particular contexts? This is a long-standing ideological canard that's more of an "us vs. them" litmus test for "the cause" than it is a particularly objective look at how RBI have functioned in the game itself. The fact that RBI are linked with two totalizing stats such as total bases and runs created indicate that there are associations between the stats that go deep into the structure of how batting orders work, and why it still makes sense to "concentrate one's fire" in terms of where to bat one's best hitter.

Looking at the data down each threshold, we see that there's a lot of similarity in the pattern of change between total bases and RBI, which is probably due to the mechanics of the batting order, which locks in a certain circumscribed ratio for these stats which is going to behave in a highly stable manner. (In other words, #3-#4-#5 hitters are likeliest to have the most TB and the most RBI, and the highest ratio between RBI and TB.)

Runs created, being a stat that models performance, operates differently and has something of a divergent profile across its thresholds. A good bit of that, of course, is Barry Bonds, and it could be that if we simply removed Bonds from the sample, we'd find that the RC numbers are a lot more similar to the RBI and TB distributions. And wouldn't that be disturbing to the folks who still need to bash RBI!

Finally, the high change group, four stats that should be no particular surprise at this point (no real "mystery guests" here): we are talking about isolated power, extra-base hits, doubles, and home runs.

One of these stats is a bit unlike the others, however, in that the overall shape of its change diverges from the "destroy the top end" approach of the other three. Which is that? It's doubles, where the assault is clearly concentrated at lower thresholds.

The consistency of gain in isolated power is more similar to the home run data than it is to the overall extra-base hit data, which again indicates that home run hitting has driven the shape of offensive upswing over the past fifteen years. Most of the work in rewriting the record book, then, can be seen as the doing of just a few players, with Bonds--the great lightning rod for a "tainted" era--stepping up to the play as combination hero/anti-Christ.

We'll come back and examine this same idea, applied to the fifteen years between 1919 and 1934--a time frame of at least equally significant change to both the game and to its record book--a bit later on.

Friday, February 18, 2011

FORAGING FOR THE "PHOUR ACES" SCENARIO...

"T-shirts! Get your T-shirts!!"
Got my "Phour Aces" T-shirt in the mail yesterday (getting me into a shirt with a collar these days is roughly as difficult as a successful loan modification...) and it set me onto the whole notion of stockpiling "dominant" pitchers. It hasn't happened all that often, as it turns out. As we'll see, the foursome of Roy Halladay, Roy Oswalt, Cliff Lee and Cole Hamels collectively possess the best four-year ERA+ average of any such combination of pitchers in the live ball era.

I decided to look for groupings of "four aces" since World War II and look at what happened to them in the season where the maximum performance expectation would occur.

It turns out that there are four other examples of the "four ace" phenomenon in addition to the 2011 Phillies. In reverse historical order,  these teams are:

1972 Orioles
1971 Cubs
1953 Indians
1951 Tigers

Four-year ERA+ data for the "Phour Aces"
We can look at the performance results for these four "four ace" teams and get a rough sense of how things worked out for these pitchers and their teams. The first thing that will leap out at you, of course, is that none of these teams won a pennant or went to the post-season in the year listed. (The Orioles went to the World Series the year before, when they had four twenty-game winners; the Indians went to the World Series the year after, when two of their starters rebounded from disappointing seasons.)

First, however, let's look at the data for the 2011 Phillies (above). There's no doubt that we're looking at an extremely impressive collection of starting pitchers: their four-year ERA+ averages (shown in the blue band) stand above the other foursomes by a solid margin. Their most recent year (2010, highlighted in orange for ease of viewing) is also the best combination of single-season performances from a foursome in the live ball era. Expectations in Philly (and, indeed, in all segments of baseball fandom, from the casual to the professional) are through the roof.

Four year ERA+ data for the 1972 Orioles foursome: 
purple shading means performance significantly below
expectations; green shading means performance
significantly above expectations.
But what actually happens in the year where everyone is expecting money in the bank? Well, we already  mentioned the fact that none of the other four teams with "four aces" made it into the post-season: let's take a look at the results for these teams in greater detail.

First up, the 1972 Orioles. Now some of you probably want to know why this isn't the 1971 Orioles, with their four twenty-game winners, who occupy this position. The answer is that the expectation surrounding Pat Dobson (who became the fourth twenty-game winner on that '71 team) was not all that high going into 1971 outside of Baltimore. But in 1972, the O's were sporting four twenty-game winners (though, as you can see, their ERA+ values in 1971 were merely good, not great). Given the rarity of the "four twenty-game winner" scenario--it's happened only once before (the 1920 White Sox)--folks following baseball in 1972 were more than a bit ga-ga over the O's starters.

Mike Cuellar, Pat Dobson, Jim Palmer, Dave McNally
So what happened? Palmer turned a corner and stepped onto the path leading to the Hall of Fame; McNally dropped down a notch. Cuellar improved, and Dobson had pretty much the same year he'd had in '71, except--

Except that the Orioles' hitting crashed. The '72 O's scored more than 200 runs less than the '71 team. Frank Robinson was gone, traded to the Dodgers; Merv Rettenmund, given a full-time job at last after hitting over .300 in the past two seasons, skidded to .233. Dave Johnson tanked. The O's starters had been 81-32 in 1971; they were 68-54 in '72, despite the fact that their aggregate ERA+ was almost exactly the same.

Four-year ERA+ data for 1971 Cubs
Not nearly so well-remembered are the 1971 Cubs, whose foursome of Fergie Jenkins, Bill Hands, Ken Holtzman and Milt Pappas actually have the next-best ERA+ in their immediately preceding season (in this case, 1970). Some of you will feel the urge to heap ridicule on poor Uncle Miltie, but he actually turned his career around after his acquisition in late June, at the tail end of the Cubs' epic twelve-game losing streak. From that point until early September, Pappas posted a 9-4 record and a 2.01 ERA and was instrumental in getting the Cubs back into the NL East race. (Fear not: they lost seven of nine in late September to go belly-up as usual.)

It's OK to call him "Uncle Miltie" now...
Bill James has already gone on record over-praising this foursome (in Win Shares), but let's give credit where credit is due. This staff was deeper across the board than the more vaunted Mets, even with Seaver and Koosman at the top of their rotation. The 1971 Cubs were given an even chance in the NL East at the time.

As you can see, Milt Pappas didn't deviate much from his overall four-year average in '71. Hands and Holtzman, however, came up a good bit short of theirs. The Cubs stumbled out of the box in 1971, but from June 2 to August 20 the foursome (led by Jenkins and Pappas) got in the groove enough to push the Cubs to a 46-28 record, which brought them to the fringes of the division race (4 1/2 games behind the Pirates). Naturally, they faded into the woodwork.

Four-year ERA+ data for 1953 Indians
Let's move on to the 1953 Indians. The 1952 squad had three twenty-game winners and spent the entire season in a frustrating, fruitless chase of the Yankees, winding up two games back. Their "four ace" rotation featured three Hall of Famers (Bob Feller, Bob Lemon, and Early Wynn) plus Mike Garcia, who was pitching better than any of the others over the 1949-52 time frame. Problem: Feller had pitched himself out in the seasons immediately following WW II and was only a shadow of his former self, despite winning 22 games in '51.

Bob Feller, Mike Garcia, Early Wynn, Bob Lemon
Bigger problem: the 1953 Yankees, who hauled off and went on an 18-game winning streak--fourteen of  them on the road (!!!)--and made it abundantly clear that no matter what the Indians' "four aces" did, it wasn't going to make much of a difference.

As is also abundantly clear, of course, these "four aces" got another shot at it in 1954, and did the world of baseball a big favor by revving things up and winning 111 games, thus preventing the Yankees from copping ten consecutive pennants.

Moral of this story: it isn't all under your control. The other teams have something to say about what happens...

The saddest story in our mini-saga of "four aces" occurred just a few years earlier, as the Detroit Tigers seemed poised to be a force in the AL equal to the task of taking on the Yankees, Indians and Red Sox. Led by Hall of Famer Hal Newhouser, the Tigers' pitching staff was deep and talented: the 1950 squad gave the Yankees a hell of a run for the pennant despite the loss of Virgil Trucks for most of the season due to arm miseries.

Four-year ERA+ data for the 1950 Tigers
On board with these two: the good-hitting Fred Hutchinson, sixth-highest in AL wins from 1946-50 (77), and Art Houtteman, a young finesse pitcher who'd recovered from a 2-16 record in 1948 to win 34 games over the next two seasons for the Tigers (including a team-leading 19 in 1950). Houtteman's preternatural maturity was highly revered by baseball insiders, but they didn't recognize that his "pitch-to-contact" style and cerebral nibbling were recipes for what we now quaintly call "career interruption."

Art Houtteman: all too briefly a star
And the '51 Tigers had their own version of that. Houtteman was drafted and missed the entire year; Trucks struggled unsuccessfully to recover his pre-1950 form. Newhouser, worked hard as a young superstar from 1944-46, also showed significant arm fatigue issues. The Tigers went from second in the league to dead last in just two years.

***

SO when we add it all up for the four "four ace" teams, the scorecard shows that two pitchers exceeded their previous four-year ERA+ averages, seven fell significantly short of those averages, and one missed the season completely. What we've got, then, is a classic coin flip. 50% of the time the pitchers performed at or above expectation; 50% of the time they performed below expectation (or didn't perform at all).

Now what does this tell us about the "Phour Aces"? Well, to temper our expectations, of course. But keep in mind that R2C2 (and yes, you can get that on a T-shirt, too...) are coming from a significantly higher performance level than any of the other "ace" combos. Even if they all decline, they can all still be solid (though the chances of them matching the '71 O's 20-win feat are exceptionally remote).

Those Orioles are worth keeping in mind for another reason. The Phillies have had a solid offense over the past 3-4 years, but they've lost a key component of it with the departure of Jayson Werth, and while we shouldn't expect Philadelphia to come up 200+ runs south of their 2010 total, they are more at risk than most. While that won't necessarily have any impact on the quality of the pitching from the "Phour," fewer runs scored often lead to fewer wins. Ask Roy Oswalt, who went 7-1 with the Phils after coming over in a trade, thanks to getting twice as much run support (4.41 r/g) as he got from the Astros (2.25).

Final thought: snap up a T-shirt, we're not going to see ph--, er, four guys this good together on one pitching staff again any time soon.

Tuesday, February 15, 2011

PINCH-HITTING KINGS 2: THE 1920s

The intricacies of roster construction issues first become prominent in the 1920s, as it's becoming clear that 1) starting pitchers are not going to be able to complete nearly as many games as had been the case previously and 2) having some decent spare hitters on hand added a small but worthwhile advantage for teams as run scoring levels increased.

So it shouldn't be too surprising to see (as the chart on the left indicates) that managers became increasingly interested in finding someone reliable to pinch-hit. Over the course of the 1920s, the number of teams who gave at least twenty at-bats to at least one pinch-hitter doubled. (The number of pennant-winning teams with a pinch-hitter given at least twenty at-bats also jumped sharply in the 20s. aided a good bit by the 1926  St. Louis Cardinals, who were the first team in baseball history to have three 20+-AB pinch-hitters in the same year--Jake Flowers, Chick Hafey, and Specs Toporcer.)

Before we jump into the Age of the Flapper, however, let's give praise to one of the members of the 1919 Black Sox team, pinch-hitter Eddie Murphy, whose nickname ("Honest" Eddie) came into being as a direct result of not being in the starting lineup. After all, what good is it to bribe a guy who might only get one chance in a game to have any influence on its outcome? Given such a fragile possibility for contributing to the delinquency of a national pastime, one would be better served if they took a glass bat up to home plate.

(And, it just so happens that this particular glass bat was made for "Honest" Eddie Murphy, but it wasn't given to him because he was resistant to the blandishments of the "Sons of Arnold Rothstein." The bat was a gift to Eddie from a former employer--back in the days when ballplayers had to have "civilian jobs" in the off-season--as a reward for Murphy making it into the World Series with the Philadelphia A's.)

Murphy was traded to the White Sox in 1915 but found himself replaced in right field by--that's right, Joe Jackson. So he became an accomplished pinch-hitter, going 12-for-32 for the World Champion 1917 Sox, and 8-for-21 in 1919. He was 13-for-33 off the bench in the very late stages of the 1920 season when the Black Sox scandal broke wide open: on October 1st, the eight players who'd been convicted of throwing the 1919 World Series were permanently barred from the game. Murphy, who hadn't played a game in the field since mid-June, found himself leading off for the remnants of the Chicago squad. However, he didn't replace Jackson in right field--he replaced Buck Weaver at third base! (And he batted leadoff for the Sox, who lost two of their last three games to avoid what would been an awkward return to the "Fall Classic.")

He also received a letter from Charles Comiskey that belied the White Sox owner's legendary reputation as a tightwad.

Gavvy Cravath
1920 was a good year for pinch-hit specialists: in addition to Murphy, four other players slapped out at least ten "replacement hits" that year (Gavvy Cravath, George Burns, Fred Nicholson, and Sammy Hale, the year's pinch-hit leader with 17). Cravath, coming to the end of an overlooked career as a Deadball-era slugger (he won six home run titles for the Phillies between 1913-1919), wound up with a .300 lifetime batting average as a pinch-hitter (32-for-106).

The two top pinch-hitters on the 1921 pennant winners, the Yankees' Chicken Hawks (8-for-23) and the Giants' Eddie Brown (11-for-39), would both find themselves back in the minors the following year--a reminder that the job of pinch-hitting was still considered marginal at best.

Teams in the 1920s found that catchers often made good pinch-hitters. John McGraw had a great deal of success in the early 20s with his platoon system at catcher--Earl Smith from the left side, and Frank Snyder from the right side. The duo batted eighth for the pennant-winning Giants in 1921 and 1922 and combined for over 80 RBI in each season, but they also combined for more than ten pinch-hits in each of those seasons.

At the 1923 World Series: Babe Ruth, Oriole owner/manager 
Jack Dunn, and Jack Bentley--the Baltimore connection...
In 1923, the Giants and Yankees met for the third consecutive time in the post-season: their top pinch-hitters in that year were outfielder Elmer Smith (a sparkling 11-for-21 for the Yankees off the bench) and pitcher Jack Bentley (10-for-20 with the Giants). Bentley, whose career as a pitcher/hitter had a pale resemblance to that of Babe Ruth, hit well in the '23 Series (including two pinch hits) but was eaten alive by Yankee bats in Game Five, surrendering seven runs in 1 1/3 IP.

McGraw began a practice of keeping young players on the Giants' roster in the 20s, breaking them in slowly with carefully selected starting assignments and a high number of pinch-hitting appearances. Two Hall of Famers began their careers in this way: Bill Terry (9-for-38 as a pinch-hitter in 1924) and Mel Ott (11-for-46 in 1927).

Bob Fothergill

Red Lucas

1929 was the biggest year for pinch-hitting to date. Bob "Fats" Fothergill concluded a five-year run in which the dietetically-challenged outfielder would hit .351. He pieced together a knockout season for the also-ran Tigers that year, collecting 19 hits in 52 ABs. Alas, the flamboyant "Fats" would never again be the same hitter, as his penchant for cream puffs dimmed his hitting abilities.

"Bonnie" Hoover and "Clyde" Tolson: a little
too close for comfort??

But the first big record-holder in the annals of pinch-hitting was a slightly-built right handed pitcher, Red Lucas. In 1929, Lucas had the first of five consecutive 10+ pinch-hit seasons with a 13-for-42 mark. When he retired in 1938, Lucas held the major league records for the most hits (116) and at-bats (447) as a pinch-hitter--records that would not be broken for nearly thirty years.

Finally, it's time to dispel an ugly rumor. Charles "Chick" Tolson, 14-for-40 as a pinch-hitter for the 1926 Chicago Cubs, was not in any way related to associate FBI director Clyde Tolson, who was the devout companion of J. Edgar Hoover, who never let Tolson get lifted for a pinch-hitter over the course of a forty-year "friendship."

Saturday, February 12, 2011

INSIDE THE BOX WITH...THE WILPONS??

It's allegory--unwittingly so, but allegory nonetheless. Who knew that Ionesco and Beckett were really precursors to the Claymation adventures of Wilpon, pere et fils--lost, lonely and vicious inside their little insider world?


And who wanted to know, anyway??

Thanks to Julia Stiles.

Wednesday, February 9, 2011

THE BBBA BIRTHYEAR SHOWDOWN 4: 1943

Every league--even one made up out of whole cloth via an arbitrary, semi-baked method--is going to have its doormat. And, sad to say, it looks as though the 43s are going to be the team to beat.

Joe Morgan, in pre-priggy days, demonstrates his singular
hand jive for 1970s Cincinatti's hot mama, Gwen Conley
As in being beaten, over and over again.

Yes, they have Joe Morgan. But even Little Joe, in his strong silent phase prior to the painful prolixity that created more voices of derision than ships launched by Helen of Troy, can only do so much.

Your roster for the hitters born in 1943:

Catchers--Andy Etchebarren, Jerry May, Frank Fernandez
First base--Lee May, Mike Epstein
Second base--Joe Morgan, Davey Johnson, Mike Andrews
Shortstop--Rico Petrocelli, Sandy Alomar Sr.
Third base--Joe Foy, Paul Schaal
Outfield--Roy White, Jose Cardenal, Lou Piniella, Merv Rettenmund, Curt Blefary, Bill Robinson

Marooned in the Bronx for most of the Yankees' fallow years:
Roy White


One thing this team has is strike-zone judgment. That fact allows us to assemble a lineup that will be a good bit more proficient at scoring runs than would appear to the case at first glance. But since your first glance tells you that these guys will score maybe 600 runs, the fact that they're gonna get to 675 (or even 700) isn't going to pass muster in this league. There just aren't enough homers to go with those walks.

So front-loading is the best approach here (as proved to be the case with the 42s). So that means we lead off one of Bill James's pets, Roy White. He's not really as good as Jim Rice (who's not as good as a whole bunch of folks in the BBWAA think he is, either...), but he makes for a fine leadoff man. Speed, power, on-base ability: Roy is definitely one of the guys you want getting the most plate appearances for your team over the course of a season.

Merv Rettenmund: .306/.397/.470
in his first three years,
.246/.366/.359 thereafter...
Let's put Little Joe in the #2 slot and pretend we are building a version of the Big Red Machine. (A whole bunch of out-of-warranty parts are gonna start falling out when we shift out of second gear, but that's what you get when you buy American: you can't say that you haven't been warned.)

We'd like to do a bit of cheating and let this team play a short-career guy, Merv Rettenmund, in center field and bat him third. Merv had several nice seasons in the early 70s with the Orioles, but he didn't have a lot of staying power. Any sim game is probably going to whack him a couple of times during the season and force you to play Jose Cardenal instead. Jose played for some pretty dismal Cubs teams in the early-mid 70s, and one gets the sense that this fact had already rubbed off on him about the time that the above picture was snapped.

Lou Piniella: "Hey, use your noggin--
batting me third is a way to get
your manager fired!"
Unfortunately, sim games balk at platooning players by best career segments, but Cardenal put up some fine numbers from 1972-78, while Merv's best years were 1969-71.

The guy who really has to bat third for this team is one of two choices to be its playing manager. Most of the recent pictures of Lou Piniella (in various stages of rage against the doleful men in blue, belying his "Sweet Lou" monicker) provide us no clues with respect to his playing career. He was a solid hitter, though he didn't draw walks and he didn't hit for power. The fact that this team is batting him third--when he rarely batted higher than fifth during his nice late-career run with the Yankees (1976-83)--is one of the reasons why this team isn't going anywhere.

Not getting choked up for the
Lee May Slurpee cup?
You'e not alone...
Batting cleanup is first baseman Lee May, who was the Big Bat discarded by the Reds in order to obtain Little Joe. Some nice irony, then, for May to be the guy most likely to be driving Morgan in. That full transaction (in December 1971: May, Tommy Helms and Jimmy Stewart to the Astros for Morgan, Jack Billingham--about whom more in a bit--Cesar Geronimo, Ed Armbrister and Denis Menke) sure makes you believe that May was perceived as the best player in that deal, doesn't it? (More irony: May hit better in the Astrodome than he did at Riverfront Stadium, and many old-time Astro fans thought the team made a good move in trading for him even after Little Joe led the Reds to three World Series in the next five years.)
Mike Epstein, getting an earful from Ted Williams

One possibility: platoon May with Mike Epstein. (This is one of the rare instances where the 43s can actually patch together a good platoon system--like the 42s, they lean heavily to the right.) As is the case with many of the players here, Epstein had a couple of excellent seasons--the first in 1969 under the tutelage of Ted Williams--but he wasn't especially consistent and he bounced around a lot. He's now a hitting instructor.

Rico Petrocell
Hitting fifth is Rico Petrocelli, who'd better hope that the 43s win the ballpark lottery and get to play at Fenway Park. Rico hit 134 homers at Fenway in his career, as opposed to just 76 on the road. Despite this, the presence of Sandy Alomar Sr. as the only other player capable of playing shortstop for this team will be enough to keep Rico in the lineup day in and day out.

We'll slot the Cardenal/Rettenmund "flip a coin"-style platoon at #6. Of course, it's an unorthodox one, since both bat right-handed.

The story of Paul Schaal in five
words or less...
Joe Foy
In the #7 slot, things aren't quite so lucky. The choice at third base is between a head case (Joe Foy) and a guy who was beaned in the head (Paul Schaal). Both of these guys can draw a walk, but Foy showed more power. It might be tough, however, to trot ol' Joe out there, given his career reversal once he was traded to the New York Mets (who gave up fourteen years of productivity from Amos Otis in order to get him--ouch!).

As with the 42s, this squad leads a bit too heavily with its right. This is not remedied by the choice of catcher. Andy Etchebarren didn't invent the mono-brow, he took it on a five-year mission to brave new worlds and scared the bejesus of new civil-eye-zations with just as much impunity as William Shatner oft-kiltered his lines. (Recent pictures of Andy, in his capacity as coach, indicate that he's taken a lawnmower to those brows, but my money is on the notion that it's a different person. The real Etchebarren must have been abducted by Klingons.)
Andy Etchebarren, best viewed from the side...

I'd be inclined to keep Frank Fernandez over Jerry May as Etchebarren's backup; while he hit just .199 in his career, Frank walked over 16% of the time and had some power.

Guys like this, hitters who didn't hit much at all for average but could draw a walk, used to be all over the place as backup players during the 60s and 70s, but they seem to be gone today--and, frankly, the game is poorer for it.

So here's that provisional batting order:

1. White lf
2. Morgan 2b
3. Piniella rf
Victim of a bad birthyear: Tommy John will be cruising
for a bruising when the 43s go for it in earnest...
4. May/Epstein 1b
5. Petrocelli ss
6. Cardenal/Rettenmund cf
7. Foy/Schaal 3b
8. Etchebarren c

The real problem for the 43s, though, is in their starting staff. Tommy John, a fine pitcher who'll one day be a Vets' Committee pick for the Hall of Fame, is nonetheless in a position to approach 20 losses in a sim season with this team. The rest of the starting staff, despite several instances of high single-season win totals, is staggeringly non-descript: Nelson Briles, Jack Billingham, Marty Pattin, and some kind of three way coin flip between short-career guys Jim Hardin, Bob Johnson, and Jim McGlothlin.

Davey Johnson, distended
by all the overdetermined
strategy he'll need to employ
Dr. Mike Marshall: there's no truth to
the rumor that he's married to the
sister of Dr. Joyce Brothers...
With that group, the radical approach for player-manager Davey Johnson (who's going to need all the brains he can squeeze out of his head, in a manner roughly analogous to the distortion effects employed by funniez.net in their effort to make Claymation safe for the world) would be to take advantage of the fact that his squad is uniquely equipped with workhorse relief pitchers.

With Mike Marshall, John Hiller, Tom Burgmeier, Vicente Romo, and Dick Selma on hand, the 43s can afford to emulate the quick hook heroics of Sparky Anderson, only with even more insidious impunity. The trick is to pull the starter at the very first sign of trouble, then pitch three or four of these guys in two out of three games. The max range of the bullpen for the 43s is 715 IP, which is closing in on 50% of the total innings pitched by a team in a regular season; that's got to be the highest such total for any relief squad in the Showdown.

John Hiller, 1974: "It's the fifth inning, already!!
How come I'm not in the game??"
And with Marty Pattin on board, the 43s skipper has another swing man type who can add to this pre-modern strategy. You could definitely get away with a four-man rotation with this squad (John, Briles, Billingham and an ongoing coin-flip between Bob Johnson, Hardin and the star-crossed McGlothlin).

Johnson is going to have to pull more than a rabbit out of his hat, however, to get this team over .500. It's all too likely that whenever the starters get pulled, they'll be behind by several runs. The hunt-and-peck offense, projected to hit less than 100 HRs, will need a semi-historic performance from the bullpen in order to overcome their opponents.

As noted earlier, somebody in this ten-team league has got to lose; despite what's probably the most interesting (and highly durable) peformance capacity of any bullpen in baseball history, the 43s are virtually certain to be the orphan children of the Showdown.