SO, yes, we've been busy again (with the French noir book--still a beast, but being tamed & it will (finally) be out in the fall ahead of a two-part, 33-film festival. (We'll direct you elsewhere for all of that when the time comes.)
But back to baseball. Remember at the end of May we were talking about the Forman et soeur breakout for the number 1/2 slots in the batting order? In that post we told you about how Mookie Betts and Shohei Ohtani were racing ahead of every other 1-2 batting order combination in baseball history with their combined 178 adjusted OPS. (In "real" numbers, that translated into a 1.025 OPS.)
And remember also that we told you that they were "just a slump away" from coming back to the pack? Well, it turned out that we were more prophetic than we expected to be...
The top line here shows what the current OPS+ value for Betts and Ohtani stands as of earlier today (not including their 7-2 loss to the Royals this evening). They have lost twenty-six points of OPS+ and a hundred points of raw OPS in the past three weeks--and the Dodgers have gone 11-12 in that time frame. The data in yellow shows us what the #1 and #2 slots have done during that time--the two superstars have been hitting just a bit over league average.
Obviously, we'll keep an eye on this and update you again soon...
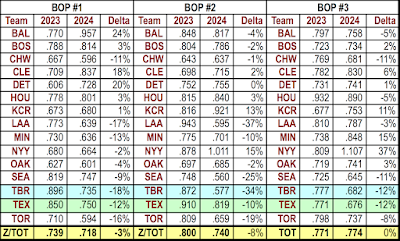
BUT now here's a sample of a more global comparison of batting order performance, showing how the top three batting order slots (which are now arguably the most important ones, as more and more teams are stacking the top of their lineup with their best/most powerful hitters) have shifted from last year to this one.
For purposes of this demonstration, we're going to focus on the American League, and show you how these changes tend to affect the on-field results in 2024 (thus far). Again, we must remind you (and ourselves that these changes are just a slump away--or a hot streak away--from a significant change; but let's go with it and see what it might tell us.At right we have the summary values that show us the change ("delta") in the OPS production for the first three batting order slots (1-2-3) in the American league.
This change is rendered in percentages rather than in raw numbers, and it's sorted in descnding order, so that the "Avg" column, which gives us that aggregate change for each team across all three top (1-2-3) batting order positions from the team with the biggest overall gain (apparently some team from New York...) to the team with the biggest overall loss (the team from Tampa Bay).
The two teams with the best overall performance change in their top three BOPs--the Yankees and the Guardians--are the teams leading the AL East and AL Central respectively. Note, though, that the pattern is not quite monolithic: the AL West leader, the Seattle Mariners, has shed 15% percent of their offensive production from the 1-2-3 slots thus far in '24.
Still, note that the Royals and the Orioles, both having strong seasons thus far, are also showing a net gain in offensive performance in the 1-2-3 slots.At left we show you the detailed breakouts of these changing BOP slots, which reveals what folks know already--the addition of Juan Soto to the Yankee lineup has given those Bronx Bombers a lot more firepower...
WE'll look at the NL soon.
And we'll have something related but entirely different for you tomorrow...stay tuned.


