Tuesday, June 18, 2024

WILLIE MAYS R.I.P.--HIS EIGHTEEN 10+ HOMER MONTHS...

ALL of us of a certain age will remember with awe and infinite pleasure the opportunities we had to see the incandescent Willie Mays in the flesh--there really was no one else quite like him. Among so many other singular things about his career, no one else ever had the distance in years between 50+ home run seasons (though if Mark McGwire had hit one more homer in 1987, he'd hold the record). 


Willie, who passed away earlier today just a month and a half after his 93rd birthday, remains the model for the ideal player--a slugging, superb-fielding center fielder who could hit for a high batting average and steal 25+ bases a year. That feat--hitting .300+, hitting 25+ homers, and stealing 25+ bases in a single season--has only been done 58 times in baseball history. While Barry Bonds now holds the record for achieving those numbers the most often--six times--Mr. Mays (his godfather...) did so four years in a row (from 1957 to 1960). 

A long time ago at this blog we feted Mays on his eightieth birthday with a list of his OPS performances by month: you are invited to revisit that post here (but not until you finish this article). What we focus on here is Mays the slugger, and the chart we present to you to commemorate him is one that shows us all eighteen times that he hit ten or more homers in a month:


It's a chart filled with wonders, including the symmetry of the three 10-HR months in 1954 (Willie's first great year) and 1965 (arguably his last truly transcendent season). 

Arguments can rage over which of Willie's months were the greatest: he had six months in which his O{S exceeded 1.200. We say throw a blanket over September 1955, May 1958, September 1959, and May/August in 1965. 

That August 1965 was clearly his top HR month (17), but he'd actually slugged higher in September 1955 and May 1958. 

These are all wondrous feats, worthy of more detailed study in the game logs at Forman et soeur. It ought to be required reading in middle school, even for the girls.

Did anyone have more 10+ homer months? We'll answer that question a bit later on...stay tuned. 

RIP Willie--life will never be as sweet again as when we could watch you do everything transcendent on a baseball field...except pitch and be a one-man ground crew. May flights of giant angels sing thee to thy rest...

Sunday, June 16, 2024

TOP BOPS FROM THE PAST TEN YEARS (2015-24)

WHAT we said we'd have for you today isn't quite ready...it needs some more background data and some time to establish some additional context--but it will be here soon.

In the meantime, we've grabbed the best performances of the past ten years by batting order position (BOP). As you'll see, there are 31 such high-flying BOPs, each registering an OPS of .950 or higher.

We've also identified the hitters who populated those batting order positions--which will doubtless clue you in on who's going to show up on the list more often than anyone else. (Cue the primordial comedy line from the late 1960s, already: "Here come de Judge!")

Of the 31 BOP seasons listed, four of them are from the now close-to-halfway-complete 2024 season. It will be interesting to see which of these will remain on the list: we suspect the two Yankee sluggers have the best bet, followed by the Dodgers' Shoheo Ohtani, with the Orioles' Gunnar Henderson least likely in our minds (and yours) due to his dearth of a track record.

Here's the full list:

BREAKING that down by BOP, that's ten of the top 31 from the #3 slot, ten from the #2 slot, six from the #4 slot, and five from the #1 slot, Seven of the slots have a SLG of .600 or higher, while twelve have a batting average of under .300. 

Fifteen of the BOPs have totaled 40 or more homers in a season, as befitting the "launch angle age" in which we live...

Note that there is an on-again, off-again pattern to these "peaks of BOP performance (Mal Waldron, eat your heart out...) that focuses on the odd years, as the chart at right indicates. (Odd years account for 21 of the top 31 BOP performances since 2015, when HRs first started sucking the air out of the room.)

MORE soon, stay tuned...

Saturday, June 15, 2024

A "1" & A '2" REDUX + A "1" & A "2" & A "3": TOP OF THE LINEUP CHANGES IN AL ('23-'24)

SO, yes, we've been busy again (with the French noir book--still a beast, but being tamed & it will (finally) be out in the fall ahead of a two-part, 33-film festival. (We'll direct you elsewhere for all of that when the time comes.)

But back to baseball. Remember at the end of May we were talking about the Forman et soeur breakout for the number 1/2 slots in the batting order? In that post we told you about how Mookie Betts and Shohei Ohtani were racing ahead of every other 1-2 batting order combination in baseball history with their combined 178 adjusted OPS. (In "real" numbers, that translated into a 1.025 OPS.)

And remember also that we told you that they were "just a slump away" from coming back to the pack? Well, it turned out that we were more prophetic than we expected to be...


The top line here shows what the current OPS+ value for Betts and Ohtani stands as of earlier today (not including their 7-2 loss to the Royals this evening). They have lost twenty-six points of OPS+ and a hundred points of raw OPS in the past three weeks--and the Dodgers have gone 11-12 in that time frame. The data in yellow shows us what the #1 and #2 slots have done during that time--the two superstars have been hitting just a bit over league average.

Obviously, we'll keep an eye on this and update you again soon...

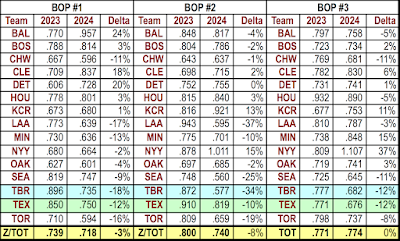
BUT now here's a sample of a more global comparison of batting order performance, showing how the top three batting order slots (which are now arguably the most important ones, as more and more teams are stacking the top of their lineup with their best/most powerful hitters) have shifted from last year to this one.

For purposes of this demonstration, we're going to focus on the American League, and show you how these changes tend to affect the on-field results in 2024 (thus far). Again, we must remind you (and ourselves that these changes are just a slump away--or a hot streak away--from a significant change; but let's go with it and see what it might tell us.

At right we have the summary values that show us the change ("delta") in the OPS production for the first three batting order slots (1-2-3) in the American league. 

This change is rendered in percentages rather than in raw numbers, and it's sorted in descnding order, so that the "Avg" column, which gives us that aggregate change for each team across all three top (1-2-3) batting order positions from the team with the biggest overall gain (apparently some team from New York...) to the team with the biggest overall loss (the team from Tampa Bay). 

The two teams with the best overall performance change in their top three BOPs--the Yankees and the Guardians--are the teams leading the AL East and AL Central respectively. Note, though, that the pattern is not quite monolithic: the AL West leader, the Seattle Mariners, has shed 15% percent of their offensive production from the 1-2-3 slots thus far in '24.

Still, note that the Royals and the Orioles, both having strong seasons thus far, are also showing a net gain in offensive performance in the 1-2-3 slots. 

At left we show you the detailed breakouts of these changing BOP slots, which reveals what folks know already--the addition of Juan Soto to the Yankee lineup has given those Bronx Bombers a lot more firepower...

WE'll look at the NL soon.

And we'll have something related but entirely different for you tomorrow...stay tuned.

Saturday, June 1, 2024

TWO MONTHS INTO 2024: BASIC STARTER/RELIEVER DATA

HERE is some data that you might not find collated in just this way anywhere else...

It's a month-by-month breakdown of the ERA performance of all 30 MLB teams, broken up between starters and relievers.

We've organized it by league (AL first) and division (East, Central, West).

Teams leading their division have their abbreviations rendered in white type.

Teams doing well but not leading their division have their abbreviations rendered in light blue type.

All others are in yellow type.

We can see that the teams doing well thus far in 2024 are all getting solid work from both components of their pitching staff.

And the Phillies, perhaps benefiting from the soft schedule they've had over the first couple months, have been lights out in a way that we don't figure anyone (even the Phillies themselves) would have predicted before the season began.

The Guardians have managed to thrive despite having mediocre starting pitching, but their bullpen has snapped back into excellent shape in May and they just keep continuing to cruise...

What division looks to have the best overall pitching? That would be the AL East... but lots of things can happen to change that. After all, no one was expecting the Red Sox to come out with such a strong display of starting pitching as what they achieved in April; and folks weren't surprised when they backslid significantly in May.

And the Yankees have done exceptionally well in terms of their starting pitching despite still having Gerrit Cole on the shelf.

Over in the NL, the Braves will need to keep that pitching in play to stay within striking distance of the high-flying Phillies, especially with Ronald Acuña Jr. on the shelf for the duration of the year.

And under our noises, the Nationals seem to be in process of some serious reinvention, with four starters (Jake Irvin, Mackenzie Gore, Trevor Williams and Mitchell Parker) all holding their own.

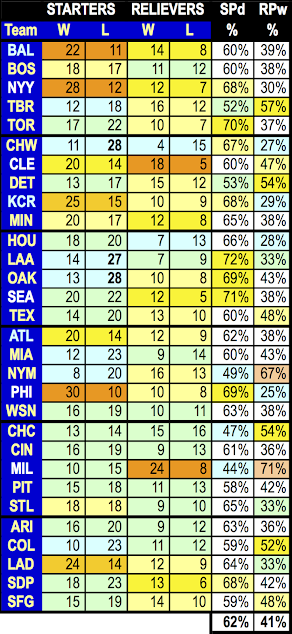
NOW let's look at starting pitcher/relief pitcher won-loss records, which have a few interesting wrinkles...

With the shift toward a higher percentage of innings for relievers continuing, we're seeing more decisions going to them as well--the average "decision percentage" for relievers is now up to 41%.

The MLB team that is having a sensational run with reliever won-loss record thus far in 2024 is none other than the Milwaukee Brewers, who are among just three teams where relievers have more decisions than the starters (the others are the Cubs and the Mets).

The Brewers are on a pace that would net them more than sixty wins from their bullpen in 2024, which would break the current record held by the Tampa Bay Rays (58, set in 2021). As you might expect, the top 25 teams in reliever wins over a season have all occurred since 2018...

The division with the best won-loss record from its relievers: that AL East again, followed closely by the AL Central (boosted by the Guardians' gaudy 18-5 record thus far.

The "left coast" seems to be getting the best won-loss serendipity from its relievers thus far: all the teams in cities adjacent to the Pacific Ocean have combined for a 57-42 record from the guys in the pen.

BUT those Brewers...just how far can they go with this? It's not just the wins, but the winning percentage: they are at .750 (currently seventh-best during the "divisional era"; the Guardians, at 18-5, are actually ahead of them at .783, second behind the current record holder (the 1976 Twins, 33-9, .786 WPCT). Of course it's a long shot, simply because there are so many more decisions that go to relievers these days...but we can dream, can't we?