We didn't expect CGs to languish forever, even in a year that featured an exceptionally slow roll-out of the "dodo bird" of pitching feats. We suspect that it will still be a down-to-the-wire proposition for the "magic" barrier of one hundred.
And the total is now up to eighteen thanks to three CGs on May 25 and the second appearance on the list by Felix Hernandez on 5/27:
--Drew Hutchinson of the Blue Jays four-hit the Chicago White Sox in a 6-0 Toronto win, striking out eight and walking no one.
--Jesse Hahn of the A's four-hit the Detroit Tigers in a 4-0 Oakland win, striking out five and walking one.
--Dallas Keuchel of the Astros added another CG loss to the 2015 ledgers as he threw an eight-inning CG while losing to the Orioles, 4-3.
--Felix Hernandez, locked in a pitching duel this evening with the Rays' Chris Archer, caught a break when the Tampa Bay relievers coughed up three runs in the top of the ninth, allowing Hernandez to coast in with a four-hit shutout in a 3-0 Mariners victory. Archer struck out more men (12 in 8 IP as opposed to Felix' eight) and gave up less hits (just two to Felix' four) but, as is sometimes the case--sometimes?? maybe we should try to measure that, eh??--he has nothing to show for it aside from some Wins Above Replacement trading stamps.
Wednesday, May 27, 2015
STARTING PITCHER IP DISTRIBUTION HISTORY, PART 1
A quick chart to "set the table" for a look at the distribution of innings pitcher in starting pitcher outings over most of baseball history. (We await with baited breath Retrosheet's relentless "backwards march" into the nineteenth century.)
We present here the percentage of starts over time (in running three-year averages) where the pitcher was pulled from the game during the first inning. As you can see, it's another "decline and decay" chart (as we've been demonstrating, there seem to be a million of these...) where the incidence is now nearing zero.
After WWII, though, you could almost say there was a strategy built around what we might call the "ultra-quick hook." Back then, teams carried nine pitchers (nine--can you believe it?) and what came out of that was the idea that a starting rotation could be altered due to the results in a single game: if a pitcher was pulled in the first inning, he could come back on two or three days rest and shift the rotation around accordingly.
But, as our table at right demonstrates, this was not an innovation based on "market inefficiency" or any other similar precept. It was barely a strategy and more an ecological necessity; it did get used more in the NL than the AL, but not notably so; and only two pennant winners in the period covered (the so-called "golden age of the ultra-quick hook") were league leaders in the category (the Dodgers and the Yankees, in the same year--1953).
The highest incidence for a single team? The 1950 Cubs are the highest in the timeframe depicted by the table, with 12, but the record is 14, by the 1928 Boston Braves, who were (mostly) managed by Rogers Hornsby and posted a 50-103 record that year.
Sunday, May 24, 2015
2015: COMPLETE GAMES #13, #14 (AND TWO MORE WE DON'T COUNT...)
Last night we had two more of those faux complete games when the Cards-Royals game got called in the sixth inning, rewarding John Lackey (the losing pitcher who went five innings) and Edinson Volquez (who went six in a 3-2 KC win) with what we will charitably call "shorties." (We will not delve even further below our usual lack of decorum by illustrating this dual feat with images of pygmies--though it's tempting.)
As we'd mentioned a few posts back, we were curious about the number of these "shorties" (CGs that are less than 8 IP in length) and so we went to Forman et fils and traced down the data, which is presented in one of our trademarked "decade-and-year" tables (over at the left).
If this data was charted, you can see that it would be another variant in the series of "Baseball Extinction Charts"--but we've got to admit that we thought there would be much more of these in the past than was actually the case. The truth is that this phenomenon has never been hugely significant, and is now official scarce (only four years with "shorties" in double figures since 1980).
We will note, though--just because we can--that the lifetime leader in faux complete games is Bobo Newsom, who managed to rack up ten of them during his career. It would be nice to say that the colorful and well-traveled Bobo might have managed to lose 'em all, but as we've seen, it's usually quite hard to lose CGs. Bobo gave it the old college try, however: his shortened CGs wound up producing a 5-5 won-loss record. (By way of comparison, Lefty Grove was 6-0 in his "shorty" CGs.)
On Thursday night (May 21) there were two 9-inning CGs, turned in by the Cubs' Kyle Hendricks (who shut out the Padres, limiting San Diego to five hits) and the Blue Jays' R.A. Dickey, who gave up the most runs (four) in a winning CG thus far in 2015.
STILL, STILL NOT PROMISIN', BUT: QMAX EXTREME GAMES THRU 5/21 WITH EXTRAS
Having thought through a few more of the contexts that this daily display of "QMAX extremes" organized by team can provide, we've slogged through more of the data collection in order to provide a few generalizations. First, here's the April chart complete (you'll need to click on it for easy reading):
Here are some basic numbers relating to the April data. Overall winning percentage in what we've called the "top hit prevention games" ("1S," the best, and "2S," next best) is .759. (Breaking that down further, that's .800 for 1S starts, .728 for 2S starts.)
The overall winning percentage in the "hit hard" region of the QMAX chart ("6S," second to worst, and "7S," was .239 in April. (Again, breaking that down further, that's .322 in 6S starts, and .145 for 7S starts.)
The actual number of starting pitcher wins, as opposed to team wins, varies somewhat, of course--which makes sense when you think about it. The overall WPCT will tend to cleave toward the middle: teams will blow a portion of their starters' better starts, and they'll recover from a portion of their starters' poor outings. The numbers quoted above are the team WPCTs.
All team "luck" is not created equal, of course. In each of the "extremes" there is fluctuation in the W-L record. As you can see, the Blue Jays actually had the most "1S-2S" games in April, with nine, but were only 5-4 in those games. Similarly, the Cubs managed to go 3-2 when their starters pitched poorly--a .600 WPCT as compared with the overall .239.
Now lets move on to the May data (same reading caveat as above...click!!):
As you can see, we've modified the chart a bit to allow for us to collate the year-to-date data with the monthly collation: you can see that at the bottom of the chart, in the rows marked "12S-tot" and "67S-tot." As you'll also see, there are daily fluctuations in the ratio of 1S/2S to 6S/7S games that are often quite extreme, but there is a relative balance in their overall numbers (as of May 21st, each category accounted for around 26% of the total games).
This fluctuates according to the overall run scoring environment that exists in the game over various times (the ratios weren't in balance in 2000, for example, when top hit prevention starts (1S/2S) were only 20% of all games, and "hit hard" games (6S/7S) comprised 32% of the total.
The general data that we tracked in April (overall WPCTs) remains very close to what we saw in that first month of 2015: .744 for 1S/2S games, .238 for 6S/7S games. There were a few more "blown games" in the 1S data, lowering the .800 April WPCT to .766 in May; and there were also some random perturbations in the 6S/7S data that made 6S games less successful (.295 as opposed to .322 in April) and 7S games more successful (.172 in May, .145 in April).
Where we can start to see larger patterns and where overall team performance starts to separate, however, is when we combine all of this data into season-to-date breakouts for each team. The most interesting extreme in the table at right can be found in the 1S/2S data. Examine that info for two teams: the Angels (LAA) and the Yankees (NYY).
Yes, that's right. The Angels have had nearly six times as many 1S/2S games thus far in 2015 (seventeen) than the Yankees (who've had only three). Early in May, folks were touting the Yankees as a team that had pulled out of its 2014 wreckage; the problem with that notion is reflected here, in their league-trailing performance in top hit prevention games from its starters. Without a reversal in that performance deficit, the Yankees will be hard-pressed to play .500 ball over 2015.
Of course, once we have the extremes, we can calculate the middle. And as you can see, we've collated the mid-range QMAX performances (3S, 4S, 5S) and have the individual team W-L data over at the right of the table.
The performance extremes in the 3S-5S range are interesting in their own right. The Astros' ability to hit HRs has brought them early and outsized success in the "meh" region of starting pitcher performance as measured by QMAX (18-8). The A's, however, have been hammered in this region (5-14).
It's clear that some teams are getting more 3S games here than 5S games, and we'd have to adjust this data to be just a bit more granular to capture that. But one value of this tripartite approach is that we can see the overall shape more clearly. For example, the Padres' starters are virtually living in the middle (30 out of 42 games, or 71% (as opposed to the overall MLB average of 48%). Being in this region can only work if one of two things is true: 1) your pitchers are throwing far more 3S games than 5S games or 2) your offense happens to cluster well in these games. (OK, a third reason: you can have an insanely great bullpen, which is a key reason why the Royals have flown so high thus far in 2015.)
More on this later, time permitting.
Tuesday, May 19, 2015
2015: COMPLETE GAMES #10, #11, #12
It's an odd year for complete games, that's for sure. We had three of them Sunday (5/17), but two of them were games in which pitchers went the distance in losses (both in the American League): the Blue Jays' Mark Buehrle in a 4-2 loss to the Astros, and Cleveland's Carlos Carrasco in a 5-1 loss to Texas.
What's odd here is the number of losing CGs occurring without analogous winning CGs happening at the same time, which used to be a relatively common occurrence as late as the 1980s.
Taking the lead in CGs in 2015 (with his second of the year) was Shelby Miller, who came within an out of the year's first no-hitter as he improved his record to 5-1 with a two-hit shutout over the Miami Marlins. It was Shelby's third consecutive "1S" game via the QMAX scale.
Overall, the 12 "officially recognized" complete games in 2015 have produced a 7-5 win-loss record for the pitchers who threw them. That's a good bit lower than what's usually the case in terms of CG WPCT, which is normally close to .800 these days.
Saturday, May 16, 2015
TROUT OR...HARPER?
It's a question that borders on blasphemy. But that's what we do here, when we're not shamelessly plugging our sponsor Fright Quotes R Us (it's the acronym that made us sell our soul, truth be told)--we blaspheme (highest blaspheme-to-phoneme ratio north of the Mason-Dixon line, in fact).
So, let's dig a deep trench with our apostasy, shall we? The whole world knows (except for the apparent vast majority of folks who've allegedly never heard of him) that Mike Trout is the greatest thing since sliced bread--or a freakin' latte on every single street-corner in these United Franchised States of America. (We left the ™ off because it doesn't scan, see...) It's amazing how much East Coast shoulder-chippiness is invested in this purported anonymity, particularly given how much coverage Trout has been getting since he first burned into our (apparently lapsed) consciousness in 2012.
For the neo-post-neos typing in their posts from their embedded battle stations at Starbucks, it seems to be all about the numerical mega-achievements that Mike has made at a tender age. They want him to be deified the way that Mickey Mantle and Willie Mays were, back when New York dominated baseball in the fifties (a New York-based team in fourteen of twenty possible World Series slots).
Well, that's not going to happen (neither the deification nor the concentration of Big Apple teams). It's the franchising. It's that oozy schmeer of spectral meta-media. It's all wired. Our TV heroes are flawed in an over-determined manner. Our pennant races/playoff schemes are similarly rigged to reward randomness.
And we're still smarting from the moralizing assault on the game that lingers in the air like a fetid epithet, a foul spray of slurs. (You know, PEDs.) That bickering backlash has fed into an offensive slow-down, and the raw numbers don't scratch that part of the itch anymore.
So a guy like Mike Trout is stuck as a darling of the so-called intelligentsia, who can rationalize some (if not all) of the lurking flaws in his game by shaping him into some kind of underdog. (Those two MVPs lost to Miguel Cabrera, for example.) There's nothing more overdetermined than this form of "underdog elitism," a faux populism for the mordant youths to drape themselves in an effort to be elegant and scruffy at the same time.
Further down the East Coast, dangerously down at the place where the cavalier and the redneck spawn side-by-side, there is a massively flawed ballplayer whose potential for truly stupendous offensive seasons (and we mean stupendous in the sense of hitting peaks such as those reached by Mantle and Mays, something that Mike Trout, great as he's been, has yet to do) is just beginning to surface.
He's a year younger than Trout, and he remains much more raw (in all senses). But a recent hot streak has pushed him into the lead in six NL offensive categories (runs, HRs, OBP, SLG, OPS and OPS+) and it serves as a reminder that for every Scylla, there's a Charibdis; for every Apollo, there's a Dionysus; for every Democratic presidential candidate, there are six bazillion Republicans.
That guy--who is that guy, the one I'm giving all the down-in-the-heels comps to, in a deal more raw than the ones he gets at Forman et fils? Hell, you know who it is...we've got his name in the title of this post, for Chrissakes. It's Bryce Harper, who just followed a three-homer game with a two-homer game and is showing the potential to put up the type of power numbers that make people (even the folks on the East Coast...) remember your name.
Blasphemy? You bet. A great chance to be completely off-base? Sure. Bryce is still a hothead. He's got the dark tights on, while Mike is draped in bright red. He's that nice reassuring moon up in the sky, who always shows you the same face. Bryce is the dark side of that moon. He's a meteor who might be a comet, or maybe a whole solar system. Maybe.
It's OK to like 'em both (and, as FQRU.com suggests, make up "fright quotes" about). Just so that you recognize that these are talents residing on the same astral continuum. The biggest story of the 2015 season might be occurring right under our noses, because nowhere outside of the DC metro area is anyone making this type of pitch for Bryce. But if there's anyone who's gonna hit 50+ homers a bunch of times in the next ten years, our money is on him, and not Trout.
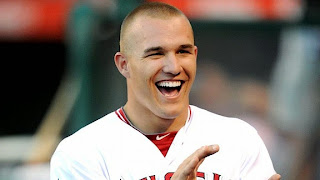
Is this where Mike Trout copped his crewcut?? |
For the neo-post-neos typing in their posts from their embedded battle stations at Starbucks, it seems to be all about the numerical mega-achievements that Mike has made at a tender age. They want him to be deified the way that Mickey Mantle and Willie Mays were, back when New York dominated baseball in the fifties (a New York-based team in fourteen of twenty possible World Series slots).
Well, that's not going to happen (neither the deification nor the concentration of Big Apple teams). It's the franchising. It's that oozy schmeer of spectral meta-media. It's all wired. Our TV heroes are flawed in an over-determined manner. Our pennant races/playoff schemes are similarly rigged to reward randomness.
And we're still smarting from the moralizing assault on the game that lingers in the air like a fetid epithet, a foul spray of slurs. (You know, PEDs.) That bickering backlash has fed into an offensive slow-down, and the raw numbers don't scratch that part of the itch anymore.
So a guy like Mike Trout is stuck as a darling of the so-called intelligentsia, who can rationalize some (if not all) of the lurking flaws in his game by shaping him into some kind of underdog. (Those two MVPs lost to Miguel Cabrera, for example.) There's nothing more overdetermined than this form of "underdog elitism," a faux populism for the mordant youths to drape themselves in an effort to be elegant and scruffy at the same time.
Further down the East Coast, dangerously down at the place where the cavalier and the redneck spawn side-by-side, there is a massively flawed ballplayer whose potential for truly stupendous offensive seasons (and we mean stupendous in the sense of hitting peaks such as those reached by Mantle and Mays, something that Mike Trout, great as he's been, has yet to do) is just beginning to surface.
He's a year younger than Trout, and he remains much more raw (in all senses). But a recent hot streak has pushed him into the lead in six NL offensive categories (runs, HRs, OBP, SLG, OPS and OPS+) and it serves as a reminder that for every Scylla, there's a Charibdis; for every Apollo, there's a Dionysus; for every Democratic presidential candidate, there are six bazillion Republicans.
That guy--who is that guy, the one I'm giving all the down-in-the-heels comps to, in a deal more raw than the ones he gets at Forman et fils? Hell, you know who it is...we've got his name in the title of this post, for Chrissakes. It's Bryce Harper, who just followed a three-homer game with a two-homer game and is showing the potential to put up the type of power numbers that make people (even the folks on the East Coast...) remember your name.
Blasphemy? You bet. A great chance to be completely off-base? Sure. Bryce is still a hothead. He's got the dark tights on, while Mike is draped in bright red. He's that nice reassuring moon up in the sky, who always shows you the same face. Bryce is the dark side of that moon. He's a meteor who might be a comet, or maybe a whole solar system. Maybe.
It's OK to like 'em both (and, as FQRU.com suggests, make up "fright quotes" about). Just so that you recognize that these are talents residing on the same astral continuum. The biggest story of the 2015 season might be occurring right under our noses, because nowhere outside of the DC metro area is anyone making this type of pitch for Bryce. But if there's anyone who's gonna hit 50+ homers a bunch of times in the next ten years, our money is on him, and not Trout.
Thursday, May 14, 2015
2015: COMPLETE GAMES #8, #9 (AND TWO WE DON'T COUNT...)
If you go to the Play Index at Forman et fils and query for 2015 CGs using the Pitching Game Finder, you will currently find a total of 11 CGs. However, in our headline, you see us noting the occurrence of CGs #8 and #9. What gives?
It's this: CGs are given in any game that ends after it has become an official game (technically, four and a half innings). That doesn't happen often (and happens much less than it used to--one day we'll put up a chart detailing the number of CGs that are less than eight innings in length).
But to our mind these are not CGs at all, but flukes of circumstance. We don't count them when it comes to tracking the record for least number of CGs; they don't represent a pitcher going the full distance, even if they are the only pitcher appearing for their team in that particular game.
So that's why we ignore and dismiss the CGs awarded to Brett Anderson of the Dodgers and Eddie Butler of the Rockies on May 8th, in a five-and-a-half inning game at Coors Field shortened by rain.
We do recognize Jered Weaver's six-hit shutout of the Astros on that same day, however. (Weaver's team, the Angels, won 2-0.) Jered threw 120 pitches, an astonishing number these days. Only the Reds' Johnny Cueto has thrown more in a game thus far this year.
And we also recognize the Giants' Chris Heston, who two-hit those same Astros and fanned 10 in a game won 8-1 by his team, the San Francisco Giants.
So, with nine CGs of 8 IP or more in 2015 thus far, we are now about 20% of the way through 2015 (yes, already...) and we are on track for 43 CGs.
Which would absolutely shatter the record for fewest CGs in a season.
2015: OUTLIERS IN NON-SAVE SITUATION (NSV) RESULTS
We are following the game from the "other side of the pond" for the next several weeks, and the run-up to that excursion has created a few more gaps in our coverage than usual (that is, from "some" gaps to a "total" gap) but we are back on it now, and will do what we can in the midst of so much else going on.
In the dawnings of the post-sabe age, we've seen glimmerings of folks measuring "luck" in ways that aren't completely tied to old, steadfast ideologies....that's tentatively a good thing. Several have focused on the Oakland A's, who seem to be discovering that one can't make assumptions that things will take of themselves when it comes to the pitching staff (particularly the bullpen).
And that is borne out in what we can see in teams' records in what Forman et fils likes to call "the non-save situation" (NSv, as we like to abbreviate it). This catch-all area for relievers who pitch in variable points in a ballgame, some important (game tied, behind in close games) and some not (blowouts on either end of the relative score) produce an aggregate .560 WPCT but don't always even out. In some cases, they go to almost shocking extremes.
And that's where the A's are in 2015. Their relievers currently are 2-8 in these games. That's a lot of tie games that have been lost. While there are many ways to calculate "luck" these days, we prefer the simplest approach, which for the purpose here would be to adjust based on the probabilities involved with won-loss records for NSV decisions: for the A's, we would adjust from that 2-8 record to 6-4, or four extra games lost via this means thus far. (Thus the A's would be 17-19 for the year, not 13-23. That tracks closely with their Pythagorean Winning Percentage, which projects them to be 18-18.)
Just how bad is a .200 WPCT in NSv games? Well, it would be the worst record in the twenty-first century. The 2003 Mets had a .233 WPCT in NSv games (7-23), and last year's Cincinnati Reds got down to .273 (9-24), but they are the only two teams from 2000 to now who are under .300 in NSv WPCT. There are only 16 teams--about one a year--whose NSv WPCT is under .400 since 2000.
In the last three seasons, the A's had been solid-to-tremendous in this breakout, including a 2012 season (28-8, .778 WPCT) that placed them at the opposite spectrum. That 2012 performance is the best in the 21st at this point, though the Astros (9-2 this year) and the Royals (7-2) are looking to challenge it.
Where are the A's getting killed? One area that stands out: the seventh inning. They have a collective ERA of 7.00 when pitching in what is, for them, a most unlucky frame. They are also 0-6 in extra inning games, which would be the location of most of their NSv situation losses.
In the dawnings of the post-sabe age, we've seen glimmerings of folks measuring "luck" in ways that aren't completely tied to old, steadfast ideologies....that's tentatively a good thing. Several have focused on the Oakland A's, who seem to be discovering that one can't make assumptions that things will take of themselves when it comes to the pitching staff (particularly the bullpen).
And that is borne out in what we can see in teams' records in what Forman et fils likes to call "the non-save situation" (NSv, as we like to abbreviate it). This catch-all area for relievers who pitch in variable points in a ballgame, some important (game tied, behind in close games) and some not (blowouts on either end of the relative score) produce an aggregate .560 WPCT but don't always even out. In some cases, they go to almost shocking extremes.
So far, a tough season for the Oakland A's and their mascot, Stomper... |
Just how bad is a .200 WPCT in NSv games? Well, it would be the worst record in the twenty-first century. The 2003 Mets had a .233 WPCT in NSv games (7-23), and last year's Cincinnati Reds got down to .273 (9-24), but they are the only two teams from 2000 to now who are under .300 in NSv WPCT. There are only 16 teams--about one a year--whose NSv WPCT is under .400 since 2000.
In the last three seasons, the A's had been solid-to-tremendous in this breakout, including a 2012 season (28-8, .778 WPCT) that placed them at the opposite spectrum. That 2012 performance is the best in the 21st at this point, though the Astros (9-2 this year) and the Royals (7-2) are looking to challenge it.
Where are the A's getting killed? One area that stands out: the seventh inning. They have a collective ERA of 7.00 when pitching in what is, for them, a most unlucky frame. They are also 0-6 in extra inning games, which would be the location of most of their NSv situation losses.
Thursday, May 7, 2015
2015: COMPLETE GAME #7
Tuesday night (5/5), Shelby Miller (traded by the Cardinals over the winter to the Braves for outfielder Jason Heyward) found his perfect patsy. (Well, OK, not quite perfect: for Miller, that would be the Milwaukee Brewers, against whom he's 5-0 with a 2.20 ERA.)
That patsy team? The Phillies, who as as lowly now as they were in the late 60s-early 70s. Miller threw a three-hit shutout against them, needing just 99 pitches, improving his record to 3-1 against them and lowering his ERA to 2.41.
Miller eats up bad teams: he's 19-6 against teams who are under .500, with a 2.75 ERA; as opposed to 11-13, 3.73 ERA against team with .500+ records. And, oddly enough, when he faces bad teams, a fine mist of particulates appear in the air, prompting folks in all corners of the stands to remark that it's beginning to look a lot like Christmas. Well, it is...for Shelby, at least.
SWINGING BACK TO SWINGING AWAY
Teams don't usually go to the World Series when their offense doesn't take walks. However, virtually nothing in life (or baseball) is monolithic; and when offensive levels drop, one starts to see instances where rules of thumb not only don't apply, they've had a hammer applied to them.
The Royals were one of three AL teams in 2014 who were in the thick of the playoff hunt despite taking walks only when absolutely necessary. (The other two teams were the O's and the M's, the latter just falling short of sparing us the incredible post-season run that the Royals have yet to come down from.) Both the Royals and the O's played around .500 ball in games where their batters drew 0-1 BBs, and they played far more of these games than the league average: the O's played 55 (29-26) and the Royals (not to be outdone) played 65 (32-33). The MLB average for 2014: 42 such games and a 16-26 record.
The two teams mitigated the large quantity of these games via extreme totals in various offensive categories. The O's hit 66 HRs in their 55 0-1 BB games last year; next closest to that were the Rockies, with 54 HRs in 56 such games. The Royals stole 62 bases (out of 75 attempts) in their 65 nolo contendere "pass on the free pass" contests, which was not only more than double the total of any other AL team in 2014, but also represented a significantly better success rate than in their other games (82% as opposed to just 66% in all 2+ BB games).
Flukish stuff? Could be. But the trend in the game, for better or worse, is shifting back to free-swinging teams. We can see this in the riotous table at left, which shows the number of teams with 50 or more 0-1 BB games on a yearly basis since back in frickin' 1914, where (as everyone knows) if Archduke Ferdinand hadn't taken a walk, we might have never had any of these wars we seem to have become so fond of, eh?
That number has ebbed and flowed, and has occasionally played "Ebb Tide" in the wee hours when it thought no one was awake; you can see that in the 40s teams all seem to know how to keep their bats on their shoulders--a trend that was reversed in the 60s, leading to that frightfully anemic year--1968--where the expanded strike zone nearly made walking illegal (8 teams with 50+ games with 0-1 BB--and MLB had only 20 teams that year, which means 40% of the teams behaved that way, as opposed to just 20% last year--six out of 30).
While things aren't quite so out of whack today as they were in 1968 (and don't get us started...), it's clear that the climate is making it possible for teams to swing away and not suffer the usual consequences.
Another way to measure this is to see what the running percentage relative to the top team in 0-1 BB G is for the teams that make it to the World Series. We ran this data for the years 1960 to the present, and that chart shows that most of the time, teams that get all the way to the Fall Classic have somewhere between 50-60% of the league leader in 0-1 BB games.
But, as you can see, that percentage of the leader is rising sharply of late. The Royals, who (of course) were #1 in such games in 2014, had a sizable impact on this chart (you can see the sharp upward movement at the right). If they make it back to the World Series this year with another league-leading figure in low-walk games, they might push the chart past the maximum (set all the way back in 1962).
Sunday, May 3, 2015
2015: COMPLETE GAME #6
Last year, there were 15 complete games in the month of April (over a total of 810 games), which established a pace for 90 over the course of 2014. (Remember that we count only CGs that involve stints of eight or more innings.)
That pace picked up enough to squeak past the all-time low for CGs (set in 2007) and we wound up with 112.
This year, we had only 5 CGs in April. (There were also fewer games played in April--quite a lot less, in fact, due to the later start of the 2015 season.) That total number of games: just 654.
Still, the pace for CGs in 2015 at the end of April was eye-poppingly lower--and probably the lowest ever: a projected season-end total of just 37.
Yesterday, CG #6 occurred when the Tigers' David Price limited the Royals to five hits and went all the way in a 2-1 win.
That brings the year-end pace up to 41.
This really is shaping up as the year where the record for least CGs in baseball history is set.
Friday, May 1, 2015
SLOW DRIP, 2015: WRENCHED OUT OF APRIL..AND DRIBBLING INTO MAY
Yes, he's back (and thank our friends at Doctors Without Borders for getting us hooked up with this sinister surgeon before the image was waterboarded--er...watermarked--by the special folks at the Science Photo Library. (For God's sake, do we have to monetize everything??)
And the fact that he's back (and we're not surprised to discover that he and his cronies really don't have your back...) means that interleague play (that great innovation now being secreted like, well, like an intravenous bag filled with molasses...) is gurgling along right on schedule.
There will be nearly double the number of interleague games as was the case in April (which is, perhaps, a very small rebuttal of T.S. Eliot's maxim about "the cruelest month"). There were 26 interleague games in April, and there will be 49 in May.
The Dodgers and Astros swept their respective series, and began the "great interleague race" (pardon us while we adjust our stethoscope...) with 3-0 records.
The Red Sox actually have the most wins, with four, but they also lost a couple of games...they were the only team to play in more than one interleague series during the month of April.
The Royals will play eight interleague games in May, all against NL Central teams.
Subscribe to:
Posts (Atom)