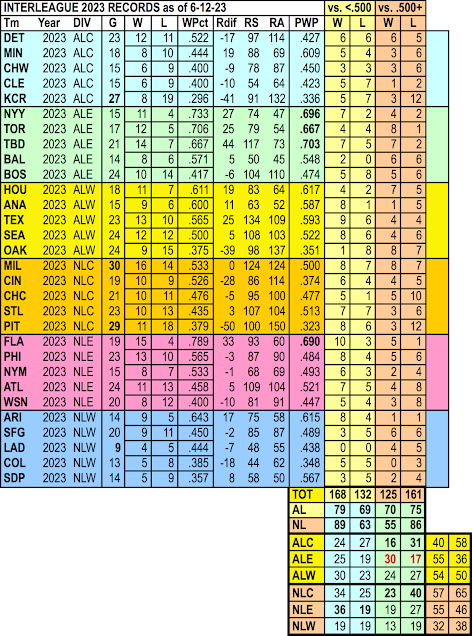
WE are distressed to discover that Forman et soeur are removing one of their long-standing features--the "situational records" query--from their roster of tools. Their word on it is that it is being assimilated into the "team query" functions and that it will be "improved."
We will hold our breath that what we've always been able to do with this bedrock feature of the site (20+ years as a durable and highly useful tool...) will not be significantly compromised by this decision.AND so we trot out the latest (hopefully not the last...) installment of data pertaining to interleague play--data that just doesn't seem to be available anywhere else.
We've structured it by league and division, so you can see how this data could be used as another way to complicate the post-season picture. (We'll return to that thought a bit later on.)
The imbalance that's been part of the rollout of expanded interleague play is still visible in the data, with the number of games played by the NL West still lagging far behind all of the other divisions. (And hey, enjoy all that extra white space, kiddies!)
There are some interesting performance discrepancies that have emerged in the data when it's broken out by quality of opponent (or, what we like to call "GvB"). Note here at the bottom of the display, where the league/division data is shown, that the NL has a much wider disparity in terms of its performance relative to (here goes...) GVB. The NL does quite well against the weaker teams in the AL (that's right, we put the "B" ahead of the "G" in the chart...we remain nothing if not mischievous) but it's been doing very poorly against the stronger teams (that 55-86 figure you see works out to a .390 WPCT). The AL's overall breakout is much tighter as you can see.
But at the division level, there is a much wider range of result. Note that the AL East, with its contingent of strong teams, is bludgeoning strong NL opposition (30-17 is a .648 pace), while their brethren in the AL Central are getting killed by those same teams (16-31, .340). Meanwhile, the NL East is pummeling the weaker teams in the AL (36-19, .654), while the NL Central is being folded, spindled and (yes...) mutilated by the AL's strong boys (23-40, .365).
BACK to what will doubtless be seen as a too-fanciful notion for how to assimilate interleague play results into how the post-season is structured. Here goes anyway: take a look at the Miami Marlins, who are simply crushing interleague opponents thus far in 2023. Let's say that they keep that up, but somehow miss making the playoffs in any of the usual ways (division win, wild card slot). Why not have the team in each league be awarded a special wild card slot for leading their league in interleague play, if they don't otherwise qualify for the post-season?
What makes it interesting is that it's quite likely that it wouldn't come into play every year, and thus would add a kind of random twist to the post-season that might prove to be intriguing. After all, the change in the post-season set-up that was used in 2022 turned out to enable the Phillies in a way that got them into the World Series; such a prospect for the "interleague wild card" team, whenever that scenario might occur, would add one more unorthodox possibility to the post-season.
You may think that's a bunch of hooey, but we like it anyway. And let's face it, the Marlins are just the type of team to slip-slide their way into the post-season by such a method. Of course, they'll have to do it "the normal way" in 2023. But hey, at least now, when you look at their current record in interleague play, you can see how they're managing to stay afloat in the race. Go Fish!
