Thursday, June 29, 2023

OH-OH-OH OHTANI! (aka THE NON-EXISTENT IDES OF JUNE)

YES, it's true, sometimes even we don't know what we mean when it comes to these titles. There's some song that "inspired" the first part, you may be able to dredge it up in your head (and then you'll curse us because you can't get rid of it)...and the second part is a rat's nest of ancient calendrical mishegas that is actually best sidestepped by jumping down a rabbit hole.

But it is still June (just barely) and the next "Ides" (according to the chimps who keep typing the Wikipedia entries hoping to randomly churn out Macbeth...) doesn't occur until well after all those upcoming fireworks add even more air pollution over the Canadian fire-infused skies that continue to linger ominously over the Midwest), so perhaps all of this will tip you off to the fact that we're going to talk about Shohei Ohtani-and-oh!-what-a-month-of-June-he's-had...

...just in case you really have fallen down a rabbit hole and have somehow missed the news, blaring continuously since the location in the month where there's supposed to be==G-D it--an Ides...

SO. Showtime...once an inferior cable supplier to HBO Max, before the klunkhead about to spindle, fold and mutilate TCM "streamlined" it to just Max, which helped 100 million people forget all about it...

(Never fear, the data is coming!)


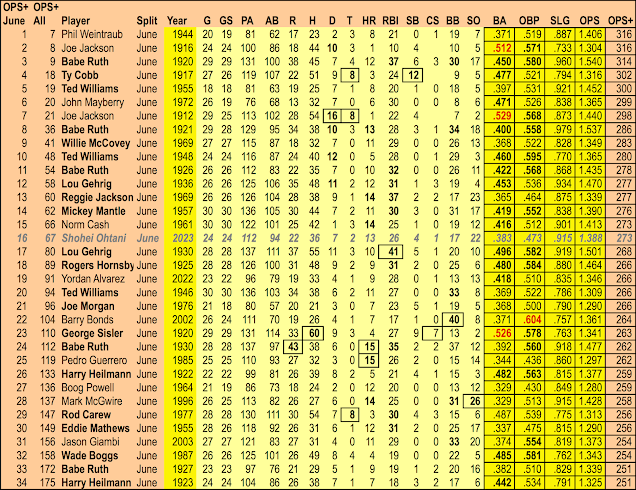
We sorted this mess of numbers (and, really, you need a mess of help to stand alone with these numbers...) by our old standby OPS+, so what you see in the above is a list of 34 players whose months of June (which has so many possible rhymes we'll only mention the most obvious one applicable here--loon...) produced an OPS+ value of 250 or higher. And, of course, the guy at the top of the list is a complete unknown, the guy Bob Dylan claims he was really writing about in "Like A Rolling Stone": the one and only Phil Weintraub. (As you probably suspected, however, we set a low PA threshold in our search to ensure that ol' Phil would show up here, just to confound everyone.)

THE gist of this (and not a moment too soon!) is that Oh-oh-oh-Ohtani ranks 16th on the list of June uber-performing batsmen. We carefully neglected to embolden the data for the players with the highest SLG, but Ohtani's (.915) is not one to sneeze at, residing as it does in the top ten. (That figure may now actually be a smidge higher, as his stats here are only through June 27: last night he went 3-for-5, collecting five total bases, for a 1.000 SLG on the night.)

There is still much hype about Ohtani having the greatest month of June ever, most of it centered around his parallel pitching performance. His almost-unique two-way performance (paging  Bob Caruthers) does need to be taken into account, but the fact is that Showtime has been a good bit more erratic on the mound since April (3-3, 3.69 in May and June). His most recent start, however, would seem to indicate that he's getting back on track (10 Ks, 1 ER over 6 IP).

Ohtani clearly loves the month of June: all of his monthly OPS values are between .831 and .893, except for June, which stands out like a pink elephant on foie gras (1.137). June (and all those damn rhymes!) just seems to bust out all over him, with 41 HRs in 442 lifetime plate appearances during the ide-less interval.

ALL of this is to say that we might not expect this level of magnificence to continue, given the pattern that the data seems to reveal. Many thought he would be the one to break the AL record in homers in 2021: as it turned out, he didn't come close. 

NONE of this is meant to disparage, demean, or diminish Showtime (though we'd like to speak to him about our exorbitant cable rates...). He is one hell of an entertainment package, and we should savor him, because it really is impossible to know just how long he can keep doing what he's doing. Here's hoping that his service is not interrupted anytime soon. 

And if he keeps up this June thang for a few more years, they may have to make an "Ides of June" no matter what the Romans (or the Wikipedia chimps) say...

[UPDATE 6/30: Ohtani has stayed hot since we wrote this, hitting his 14th HR in June last night, giving him a shot at tying Babe Ruth (1930) and Pedro Guerrero (1985) for the most June HRs for those in the elite OPS+ range. He's also moved up to 11th best OPS+ for June (279) and 51st all-time. We're still not sure that he's had the "greatest June ever," but we are sure that June really is Ohtani's month in a way that doesn't seem to be the case for anyone else. ]

Thursday, June 22, 2023

THE A's JOIN, THEN LEAVE, THE "7 & 7" CLUB...AND WE TAKE LEAVE OF OUR SENSES.

WE'RE now nine days and counting past the Oakland A's seven-game skein of glorious anomaly, capped by the "reverse boycott" that baseball's vodka-in-his-veins commissioner Rob "Mr. Potato Head" Manfred (known in these concentric circles as "Man Rob Fred") attempted to buzz-kill with a blunt instrument (aka the garbled syntax of a mob lawyer), and anything resembling an afterglow is indeed non-existent.

The A's uncanny ability to hang tough in one-run games abandoned them, and when we looked up from our ritual breakfast of bananas and ice cream, our potassium and sugar-glazed eyes dimly made out the fact that the ragamuffs had now dropped seven in a row, the type of symmetrical volte-face that usually occurs only in cartoons. 

And so we were moved to contact the austere but incurably helpful Katie Sharp at Forman et soeur, in hopes of identifying the teams who shared in the A's latest feat (seven-up, seven-down) so that we could isolate this "7 & 7" club, named after the famous drink that TCM's barroom braggadociant Eddie Muller snubbed in his latest book (the almost-charming, never-disarming NOIR BAR). 

Katie, who is very sharp, reminded us that it really wasn't a good idea to put Seagrams & Seven™ together too early in the day because the A's had already "been and gone" as regards the "7 & 7 Club"--in plain fact (plainer than the nose on our face, even if one too many early-afternoon tongue-exercises with ice cubes had made us blearily unaware that our nose was actually semi-existent...) because they'd just lost their eighth game in a row, a 6-1 loss to the Cleveland Guardians.

But we were determined to salvage our blog post idea despite barely being able to discern the computer screen in front of us, much less the slippery, uncooperative keyboard (sit still, you beast! Oh, sorry, that's a different set of repetitive numbers, isn't it...). And Katie didn't bar the door, providing us with a list of nineteen teams that kinda-sorta fit into the original concept, which she modified for us, repeating slowly several rimes since it was clear we needed to hear it iteratively in order for it to lodge in our brain long enough to transmit to you, dear reader: the "at least seven wins followed by at least seven losses" club. 

And so the clouds lifted, or at least seemed to move...whatever they were doing, they did it long enough for us to compile this list, and get it into a form where you (not us!) will be able to read it. And here 'tis, over at the left, or maybe above us and to the left...or maybe to the left and above--anyway, you can find it...we're getting a little sleepy even as we look for a pair of scissors with which to cut up another of Eddie Muller's ties.

What may shock you regarding that list (aside from the fact that we actually got it posted...) is the presence on it of so many successful teams. You check our math (please!) but we count fourteen of the nineteen teams on this list with final season records above .500. (The A's clearly are not going to be number fifteen.) Two teams on this list, the 1930 Cards and the 2008 Rays, actually made it into the World Series despite having this careening occurrence in the midst of their season. 

IN fact, the A's are going to trail this pack by so much that they kind of dwarf the concept of anomaly itself, staggering their way (along with us) to the realm of the meta-anomaly (best served chilled, or possibly absorbed directly through the scalp). The team with the worst record on this list, the 2000 Pirates, almost won 70 games, and one of the others, the 1998 Reds, were kind enough to get the 7-7 thang into their volte-face variant (which actually consisted of ten straight wins, followed by eight straight losses). 

Now that the A's have left the actual "7 and 7" club, there are only eight members, half of 'em from the hard-drinking Midwest. All of them actually finished the year over .500, so it would never do for the A's to have stopped there and break up such a splendidly matched set. (There's a salacious reference in there somewhere, but we are doing everything we can to not let it escape.)

When we sober up, we're going to ask Katie if there are any teams that won seven, then lost seven, then won seven, then...well, hell, you can clearly see (we can't!!) where this is going. The perfect Sisyphean (a word hard to pronounce when you're pickled...) team is one that wins four, loses four, and "rinses and repeats" like that ad nauseum (ah, yes, we wondered when that would be coming...) over the course of a full season, all the way to 81-81. Of course, no one has done that, because the 162-game schedule doesn't permit such symmetrical nonsense to occur. And waddya say we raise our glass to that fact as we stagger off into the gloaming...altogether now--"Sisyphus is not symmetrical...Sisyphus is not symmetrical...where the bleep is my designated driver?"

Sunday, June 18, 2023

A PROOF-OF-PRINCIPLE MONTHLY "RESULT BY PITCHER ROLE" SUMMARY...

 ...submitted, as Rod Serling would say, for your approval.

The idea here--shown to you as one-sixth of what the full report would look like (there would be six total components, sorted by MLB's six divisions)--is to give us a bird's eye view of how the two components of pitching play out for teams in their monthly cycles.


We are showing the 2023 results for the AL Central, which has some interesting range of performance to use for purposes of this demonstration. The "sOPS+" ranking, which is the primary performance value summary used in the Forman et soeur report cluster, works in the opposite direction from OPS+ for hitters: anything above 100 is a below average performance. 

We've color-coded the good-bad extremes in the monthly date for the five ALC teams, which for the purposes of locating nuance within this data points us directly at the Detroit Tigers, who had a solid (but also extra-lucky) performance from their relievers in May: that 8-1 won-loss record for the bullpen guys allowed the Tigers to put together a somewhat deceptive 16-11 mark.

And there's nothing but bad news to be discovered in the Royals' data--nothing but green-colored cells displaying how deep below league average their pitchers have been since Day One of the '23 season.

Note the SP% and Dec% columns at the right end of the chart. They show you the percentage of IP in each month pitched by the starting pitchers, and the percentage of decisions--actual assigned wins/losses--credited (or debited) to the starters. This data seems a bit random, but we'll track it for awhile and see what it looks like after we have enough of it on hand...

WE'RE going to throw together the full report (all six divisions...) using this same format when we get to the end of the month.

Wednesday, June 14, 2023

THE A-NOMALOUS A's & THEIR NOT-SO-PHANTOM FANS

LAST night was a singular event in baseball history, when a ravaged and often reviled fan base turned the other cheek, crafting a ragamuffin miracle from the dross of corporate greed and unending chicanery. Long-suffering lovers of the Oakland A's banded together in a celebration that doubled as a devastating critique of baseball's ongoing duplicity regarding the fate of a franchise that has always been unlucky enough to be in something akin to wayward hands.

With their team stripped down into a tattered facsimile of the "less is more" miracles performed by Billy Beane for so many years until an unusually reptilian ownership group opened a trap door that plunged the team into a freefall equally only by a similar corporate chicanery that befell the Cleveland Spiders in 1899 (prime time for those we now all call "robber barons," natch), the fans who'd boycotted the unseemly fate of their team as it seemingly marched toward the worst won-loss record in baseball history suddenly performed an astonishing volte-face, staging a brilliant, spontaneous, and utterly inspired "reverse boycott." The result was a night for the ages that may not have silenced all of the professional cynics, or have swayed the game's gatekeepers, but that resonated in ways that may yet surface into the discussion of a more equitable future for a game and business still desperately in need of self-healing.

For more details of this singular event, you're directed to the brilliant article at The Athletic by Melissa Lockard, which gives full voice to the organizers and sensitively walks a fine line in the world of "objective reporting" to provide an indelible picture of the emotional atmosphere that surrounded the evening. Lockard, clearly swayed by what she witnessed, wisely allows the quotes from the event's organizers to do the heavy lifting in making clear that this was both a protest and a love-in, a clarion call to the feckless money-changers who seek to control not only the vertical and the horizontal, but the diagaonal as well--a defiant but loving plea for community over "crack-up capitalism." Its chances of turning the tide may well be slim, but the message is both of its time and one for the ages: man (and baseball) cannot live by spreadsheets alone. The people matter.

Barely mentioned in Lockard's article, however, is the equally astonishing fact that the ballclub itself is making some exceptionally anomalous rumblings for one that lost 46 of its first 56 games. After being called the "worst team ever seen" by some ostensibly qualified insiders, the rag-tag team has gotten off the deck and done something that no one in anything approach their right mind could have predicted: with a thrilling, highly emotional 2-1 win against their often-mentioned-in-the-same-breath opponents, the high-fling Tampa Bay Rays, the A's won their seventh game in a row and, for one night at least, climbed out of 30th place in the standings (passing the lowly, forlorn Kansas City Royals by percentage points).

THE rumblings had started nearly two weeks ago, when the A's pitching--simply execrable for the first two months of the 2023 season--suddenly rose from the dead and contributed significantly to two wins against the first-place Atlanta Braves. After a loss on the final day of May, the A's next road trip seemingly returned them to their "dead man walking" modus operandi, with three losses in Miami and a typical defeat-snatched-from victory affair in their opening game in Pittsburgh.

But then there were two wins against the Pirates, including an improbable 11-2 rout catalyzed by professional castoff Jace Peterson (5 hits, 2 HR, 5 RBI) The next day, the entire A's lineup came alive, with every starter getting at least one hit en route to a 17-hit game punctuated by a seven-run first inning, raising eyebrows across the mediascape (including the time-honored quip from waggish wags that such reports must be erroneous). 

And then in Milwaukee, the strange goings-on kept going on, as the A's swept the Brewers (rising up, for some of us at least, against the hoary ghost of Budzilla), making canny use of the "opener" in the first game to calm the often jangled nerves of struggling starter Luis Medina, getting a fine start from their recently returned 2022 All-Star representative Paul Blackburn in the second game, and smacking clutch homers and riding the rollercoaster with a still-shaky bullpen to bring home their fifth win in a row (final score: 8-6), making them the most anomalous ultra-bad team in baseball history.

SO now to our buried lede--the "a-nomalous A's." Research all of the truly bad teams in baseball history, and you will find a total dearth of "winning streaks." Now that may seem inordinately obvious, of course, since it's hard to win a lot of games in a row when you're not winning any games at all. Nonetheless, it's instructive than none of the worst teams in baseball history had ever won more than five games in a row during their "crash-and-burn seasons." Here's a quick survey, from the very worst of the worst to the awfully worse:

1916 PHILADELPHIA A's (36-117): Never won three games in a row. Won two games in a row five times. From May 31 through August 8, posted a 5-58 record (.079).

1935 BOSTON BRAVES (38-115): Won four games in a row once. Won three games in a row twice.

1962 NEW YORK METS (40-120): Won three games in a row twice.

1904 WASHINGTON SENATORS (38-113): Won three games in a row once. Won two games in a row four times. Started the season 0-13-1.

2003 DETROIT TIGERS (43-119): Won four games in a row once. Won three games in a row four times. (Wins in streaks represented nearly 40% of their total wins for the season.)

1952 PITTSBURGH PIRATES (42-112): Never won three games in a row. Won two games in a row eight times. Had one stretch in the season (June 10-19) where they played .500 ball over ten games.

1939 ST. LOUIS BROWNS (43-111): Never won three games in a row. Won two games in a row nine times. Played .500 ball over one ten-game stretch (September 10-17).

1941 PHILADELPHIA PHILLIES (43-111): Won three games in a row twice.

2018 BALTIMORE ORIOLES (47-115): Won four games in a row once. Won three games in a row twice.

2019 DETROIT TIGERS (47-114): Won five games in a row once--April 2-7 (known in the world of baseball--and elsewhere-as "shooting your wad early"). Won three games in a row twice (but never after May).  (Went 10-40 from June 1-July 31.)

There you have it. Ten truly terrible teams, and amongst the wreckage there we find one five-game win streak, three four-game winning streaks, and fifteen three-game winning streaks.

And then there are these anomalous A's, cruising to join the infamously damned, soon (apparently) to be banished to America's analogue of the City of Mahagonny, who, via some collectively unconscious force of will, defy the odds and high-wire-walk their way into a five-game winning streak. Surely it will all come to an end when they arrive home and have a four-game series with the Rays, right? The team with the best record in baseball, the team that eviscerated them in April, outscoring them 29-5 over the three games?

But somehow, some way, it doesn't come to an end. The A's Rule 5 offseason pickup, first baseman Ryan Noda, caps a four-run fifth inning against the Rays' Zac Eflin (8-1 coming into the game); they survive a three-run counterblast from Jose Siri in the sixth, and embattled lefty Ken Waldichuk, pulled from the A's collective wreckage of a starting rotation after posting an unsightly 7.43 ERA, closes out the game with three shutout innings of relief, striking out five and recording the first save of his career. 

At which point the A's truly became anomalous...but then there was the serendipitous timing of the "reverse boycott," which brought in the largest crowd of the year, a crowd revved up by an inchoate but palpable amor fati which randomly aligned with a 26-man crew trying with all their might to salvage their wrecked vessel and give it a chance to sail home with body and soul intact.

Serendipity took note, and gave the A's several needed boosts in another tense, one-run game (and these anomalous A's have been surprisingly good in such games, even as they were also shot down from the trees in so many blowouts during April and May). In the ninth inning, fledgling closer Trevor May was wild, but catcher Shea Langeliers made an immaculate throw that just beat the Rays' fleet Randy Arozarena to second base; the play was contested by Tampa, but the ruling held. The dangerous Siri then batted, representing the go-ahead run for the Rays, but May, perhaps sensing his moment, found the plate and made quick work of the quixotic slugger, striking him out on three pitches to put the finishing touches on the dual "reverse boycott" that the team and the fans had welded together. 

So--seven wins in a row, representing 37% of the A's total number of wins thus far in this season of surrealism. Will the A's win all of the rest of their games in '23, as the Tango Love Pie™ facetiously suggested over at Twitter? Of course not. Will their uplift turn quickly into subsidence? Maybe. After all, if they turn into a "merely bad" team, that would be anti-climactic in a world that seems to crave apocalypse, spectacle, reality TV and rogue politicians. It's likely best to savor the anomaly for what it tells us about life in an increasingly benighted world, and the potential that exists for that world to save itself from its own greed and self-destruction. 

Give the A's their due: they've done something that no team in their position has ever done before--and no matter what happens from this point forward, they've done something that all of us should aspire to--they've reclaimed their dignity. More power to them--and maybe if we think and wish and hope and pray, the A's and Oakland will be saved from their feckless "blue jean heir" owner. Chances are slim, but 'tis still a consummation devoutly to be wished. Stay tuned...
Tuesday, June 13, 2023

INTERLEAGUE PLAY 2023: UPDATE AS OF 6/12

WE are distressed to discover that Forman et soeur are removing one of their long-standing features--the "situational records" query--from their roster of tools. Their word on it is that it is being assimilated into the "team query" functions and that it will be "improved." 

We will hold our breath that what we've always been able to do with this bedrock feature of the site (20+ years as a durable and highly useful tool...) will not be significantly compromised by this decision.

AND so we trot out the latest (hopefully not the last...) installment of data pertaining to interleague play--data that just doesn't seem to be available anywhere else. 

We've structured it by league and division, so you can see how this data could be used as another way to complicate the post-season picture. (We'll return to that thought a bit later on.)

The imbalance that's been part of the rollout of expanded interleague play is still visible in the data, with the number of games played by the NL West still lagging far behind all of the other divisions. (And hey, enjoy all that extra white space, kiddies!) 

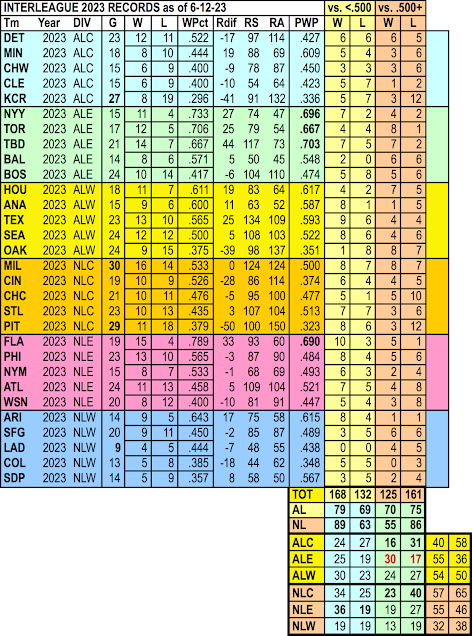
There are some interesting performance discrepancies that have emerged in the data when it's broken out by quality of opponent (or, what we like to call "GvB"). Note here at the bottom of the display, where the league/division data is shown, that the NL has a much wider disparity in terms of its performance relative to (here goes...) GVB. The NL does quite well against the weaker teams in the AL (that's right, we put the "B" ahead of the "G" in the chart...we remain nothing if not mischievous) but it's been doing very poorly against the stronger teams (that 55-86 figure you see works out to a .390 WPCT). The AL's overall breakout is much tighter as you can see.

But at the division level, there is a much wider range of result. Note that the AL East, with its contingent of strong teams, is bludgeoning strong NL opposition (30-17 is a .648 pace), while their brethren in the AL Central are getting killed by those same teams (16-31, .340). Meanwhile, the NL East is pummeling the weaker teams in the AL (36-19, .654), while the NL Central is being folded, spindled and (yes...) mutilated by the AL's strong boys (23-40, .365). 

BACK to what will doubtless be seen as a too-fanciful notion for how to assimilate interleague play results into how the post-season is structured. Here goes anyway: take a look at the Miami Marlins, who are simply crushing interleague opponents thus far in 2023. Let's say that they keep that up, but somehow miss making the playoffs in any of the usual ways (division win, wild card slot). Why not have the team in each league be awarded a special wild card slot for leading their league in interleague play, if they don't otherwise qualify for the post-season?

What makes it interesting is that it's quite likely that it wouldn't come into play every year, and thus would add a kind of random twist to the post-season that might prove to be intriguing. After all, the change in the post-season set-up that was used in 2022 turned out to enable the Phillies in a way that got them into the World Series; such a prospect for the "interleague wild card" team, whenever that scenario might occur, would add one more unorthodox possibility to the post-season. 

You may think that's a bunch of hooey, but we like it anyway. And let's face it, the Marlins are just the type of team to slip-slide their way into the post-season by such a method. Of course, they'll have to do it "the normal way" in 2023. But hey, at least now, when you look at their current record in interleague play, you can see how they're managing to stay afloat in the race. Go Fish!

Monday, June 12, 2023

3+ HR IN A GAME: #648

WE gave you a lot of data about 3+ HR games a while back [June 2nd, to be exact], which included the fact that there were 647 such incidences since the first time it happened (in 1922).

That fact is now outdated. On June 8th, the Guardians' José Ramirez hit three homers in his home park (Progressive Field, one of the stingier parks in terms of allowing HRs...) during a game against the Red Sox--a game that the Guardians won, 10-3. 

Where this opens up further new data is in the fact that Ramirez is a switch-hitter. We covered a number of breakdown facts in our original post, but one fact that we didn't cover was how many times 3+ HR games have involved switch-hitters. 

SO consider this our penance and recompense for not doing a deep enough dive on this in the first place: here goes--

--This was the 38th time that a switch hitter has hit 3+ HRs in a game. 

--The first switch-hitter to do it was, that's right, Mickey Mantle. The date: May 13, 1955. The place: Yankee Stadium. The opponent: the Detroit Tigers. (It was the only time Mantle did it.)

--Pete Rose has done it--April 29, 1978, against the New York Mets...at Shea Stadium, where five years earlier, he'd created a ruckus by decking Mets SS Bud Harrelson during the NLCS, which unleashed Shea's boo-birds--who were likely still in a booing mood when Pete hit the three-in-a-game.

Rose was also the oldest switch-hitter to do it for almost forty years, when Victor Martinez, 161 days older (37 years, 176 days) hit three for the Tigers against the Kansas City Royals. The youngest? The Mets' Jose Reyes (23 years, 65 days), who hit three against the Phillies on August 15, 2006. 

--Any switch-hitters hit four HRs in a game? Yes, Mark Whiten hit four for the Cardinals against the Cincinnati Reds on September 7. 1993. 

--What season had the most 3+ HR games from switch-hitters? That would be 2006, with Chipper Jones and Mark Teixeira joining Reyes with the "homer hat trick." We now have two in 2023, so there's some chance that the record will at least get tied this year. 

--What switch-hitter has had the most 3+ HR games? That record is jointly held by Teixeira and Eddie Murray, who each had three.

NOTE that 23 of the 3+ HR games by switch-hitters have occurred during the twenty-first century. And they said they were a dying breed...(switch-hitters, that is: HRs are as common as weeds in a garden).

And note that no switch-hitter has ever had two 3+ HR games in a single season. Perhaps José will be the first. Then again, perhaps not...stay tuned!

Friday, June 9, 2023

EXPANSIONIST EXTRAVAGANZA/3: ROUND 2 RESULTS

Back to our "best of the worst" NCAA tourney, which produced some routs in Round 1 thanks to some particularly bad expansion teams. (If you're just coming in on this, we took the 14 first-year expansion teams and supplemented them with the worst Dodgers and Yankees teams in the expansion era to create a "Sour 16" with which to lurch sideways; the hope was that we would not wind up with the Dodgers vs. Yankees in the final round.)

AND, as you can see, our wish was granted. The 1990 Yankees were bounced from the competition here in the second round, saving us from a "bad outcome" of our own devising. 

All four matches were much closer than what we saw in Round 1, however: the losing teams all had at least an outside chance of prevailing as things wound down to the last ~18 games or so. Most of the summary date looks reasonably orthodox, but there are some odd things to be found in the Dodgers-Diamondbacks and Rays-Yankees showdowns. Note that both these races feature lopsided disparities in results of one-run games (whereas the Angels-Colts and Royals-Rockies were as tight in this category as it's possible to get). Note as well that the Dodgers and D-backs both had no home field advantage--both teams played significantly better on the road. Finally, note that the Yankees outscored the Rays in their 162-game showdown, but still managed to lose. (Sorry, we left our violins at home...)

None of these leagues proved to be exceptionally high scoring--even the Royals-Rockies, with Mile High Stadium in the mix (it, not Coors, was in operation in 1993...) did not produce the lusty totals that are often associated with Denver baseball. 

Let's look at some of the notable hitters in the tourney--though due to the compressed scoring, there are no particularly stunning offensive performances to be found in Round 2. The best overall seasons came from L.A. leadoff men, both of whom had performed at much loftier levels against lesser competition in Round 1. Albie Pearson and Brett Butler will get to face off in Round 3, as their teams advanced to a showdown that should prove especially interesting. Solid seasons were turned in by Lou Piniella, Andres Galarraga, Jesse Barfield and Rays' part-timer Bubba Trammell. But who would have expected Fred McGriff to hit only nine homers in a season?

The list of notable pitchers in Round 2 is dominated by bullpen artists. And as you'll see, it's the bullpen that had a lot to do with  the Yankees turning in an 18-34 record in one-run games and sending them home. 

The best starter in Round 2? The Angels' Eli Grba (that's pronounced just the way it looks, by the way: "Grr-buh"). Other starters who turned up well included Orel Hershiser, Amaury Telemaco, Armando Reynoso, and Rolando Arrojo

Some unheralded relief folks turned in tremendous years: Bobby Tiefenauer for the Colts, Steve Wilson for the Dodgers, Darren Holmes for the Rox, Lee Guetterman for the Yankees. But the best overall reliever performances came from the Angels' Tom Morgan, the Royals' Moe Drabowsky, and--best of all--the Rays' Roberto Hernandez (1.30 ERA, 43 saves). Tampa's slot in R3 is surely due to the yeoman efforts of Hernandez...

So here's what the NCAA chart looks like as we head to Round 3. As noted, the Angels and Dodgers will square off in a battle of West Coast "titans" (though that's clearly stretching things...). And the Rays and the Royals will mix it up to see which one will make it into the final round. Stay tuned...

Thursday, June 8, 2023

ARRAEZ ARRIVES ON THE NATIONAL STAGE...

YES, we mentioned Luis Arraez for the first time here about 10 days ago...suggesting that MLB needs more of his type of hitter. (We also mentioned the need for fewer analysts of a certain type as well, but we'll bypass that for now.) Lo and behold, it's two days past D-Day and here is Arraez hitting .403, the highest June batting average since Chipper Jones took wing back in 2008.

Now let's be honest: Arraez is wonderful, but he's a two-dimensional player in his own right, and one might rightfully claim that it's really a dimension and a half. His knees are a bit suspect, so he has no speed. He has little power (not even a robust number of doubles). He doesn't work especially hard at selecting pitches, so he doesn't add an outsized number of walks to his arsenal. 

All he has done is hit--and he's done it since the age of 17, when he first showed up as a scrawny kid with the barest trace of a stubbly beard in the Dominican Summer League (the year was 2014--a veritable lifetime ago). He hit .347 there and kept on hitting at every stop in the minors, overcoming a knee injury that cost him most of 2017. In 2019 he jumped into the majors, hitting .334 for the Twins as arguably the most anomalous player anywhere thanks to the homer-happy environment he joined (and summarily ignored).

Now he's in Miami, in a trade that many dismissed/disdained. (The fact that Arraez won the AL batting title in '22 actually seemed to goad many "analysts" to downgrade their estimation of him.) Somehow Florida in the midst of the culture wars, on a team that rather openly defies the so-called tenets of the state's other Il Duce wannabe, is a perfect place for a now-chunky but still wispily-bearded post-modern baseball misfit to magically fit in--and flower. 

SO how the heck is he doing it, given that a cadre of twelve-ounce curl intellectuals suggest that the game has changed so utterly that no one can simply try to get base hits anymore? (Even the best of these guys, Eno Sarris, is still a couple bottles short of a six-pack.) The possibilities of "see the ball, hit the ball" have been so orphaned by these folk that they pretty much sidestep their knee-jerk approach to characterizing the "science of hitting" when they look at Luis--and then they simply avoid him altogether, in one awkward goose-step.

Of course, a .400 BA (even though it's "meaningless"...) is hard to ignore. 

Looking at the normal data we have readily available (as opposed to the Statcast balsamic vinaigrette honeytrap...) we can see it plain as the stubble on Luis' face: he's hitting lefties with a level of authority well beyond what he's done in the past (.382 against them this year, as opposed to .261 from 2019-22). 

It's also likely that the death of the shift--which hasn't produced more singles overall in MLB (for reasons that require a longer discussion than we'll be giving it here)--is, in this case at least, working in Arraez' favor: he's hitting .362 in 2023 on ground balls, which is almost exactly a hundred points better than what his lifetime BA on grounders was from 2019-22 (.263). 

There's more, but we'll save it for a future installment should Luis manage to keep .400 in view for any significant amount of time. (BTW, our YEPS projection tool is not optimistic in that regard; but it does suggest that Arraez will hit a bit upwards of .350 this year--.354, to be exact. That would be the highest full-season batting average in MLB since Josh Hamilton hit .359 in 2010.)

Let's close by reminding you that we are not against home runs: we just want fewer of them. And we want a greater diversity of hitting styles, regardless of whether "singles hitters are overrated due to batting average" or other such epithets that simply fetishize the home run to the point where Joey Gallo is defended by "sabermetricians" as a legitimate role model for hitting. (Gallo is rather cool, to be honest, but trust us when we say that one of him is enough. A few dozen Luis Arraezes, however, would be a Godsend for the sport. If you're the prayerful type, feel free to drop to your knees and clasp your hands together...)

Friday, June 2, 2023

MUCH ADO ON JUNE 2: LOU, THE BABE, AND 3+ HOMER GAMES

June 2 is a date that is especially packed with baseball drama. It's suffused with the tragic story of Lou Gehrig, who passed away from the effects of amyotropic lateral sclerosis on that date in 1941. (Fast forward today to the similar sad case of Sarah Langs, whose plight proves that history can repeat itself even if we're still paying attention to it.)

But June 2 is also the day that Babe Ruth retired. It was 1935, and the Babe had been worse for wear for awhile. He'd left the Yankees amid considerable acrimony: he'd wanted to become the manager, but owner Jake Ruppert had waved away such a scenario. So Ruth returned to Boston, but he'd aged far more than a single winter by the time he took up with the Braves. Though he homered on Opening Day, he would soon endure an agonizing 2-for-40 slump and would be hitting just .145 on May 23.

But there was a "last hurrah" two days later, when Ruth provided one last indelible reminder of why he'd gained the nickname "Sultan of Swat." Four hits, six RBI, and three homers came off his bat that day in Pittsburgh, with the ultra-felicitous #714 soaring over the roof at Forbes Field to cap what is still the greatest career in baseball history. (Ruth walked away from a chance to hit a fourth homer in the game, choosing to leave the game after what proved to be his final mammoth shot. And it soon was clear that he was spent: though he played in five more games, #714 was--appropriately enough--his last-ever hit.)

Ruth's three-homer game was the 36th time a batter had hit three or more homers in a game--the rage for the long ball that he'd initiated was not yet its own pandemic. (Fittingly, the only man since the advent of two-league baseball in 1901 to hit four homers in a game was Lou Gehrig, who'd done it a day later three years before Ruth hung up his spikes.) 

And all of that sets us off on a something of a deep dive into that not-so-rarified world of 3+ homer games. We'll get out the wading side of the pool, leaving Joe the P. to dish on the cream of the crop--Gehrig and the fifteen fine fellows who followed him to four-homer-in-a-game glory. (We all need to watch out for those "aw shucks" glory hogs.) By contrast, the ever-increasing volume of three-homers-in-a-game has made it into something of a workingman's pursuit.

The TimeGrid™ at left shows what we mean when we are talking about proliferation (fortunately, not of the nuclear kind). Your eyes do not deceive you when you see that number: 647, which is the total of 3+ homer games hit since Ken Williams was the first to hit three homers in a game just one hundred and one years ago. (The exact date: April 22, 1922. Williams' St. Louis Browns, who had their best year but still came up one game short of a pennant, won the game 10-7.)

Ruth had one other 3-homer game in 1930, but he specialized in the 2-homer game (he did that 70 times, still a record). The numbers for three-homer games motorvate along at a reasonably sleepy pace throughout the 30s and 40s, with the war effort and the "balata ball" taking some of the steam out of things. As you can see, the uptick starts to occur in 1950, the first big "boom year" in offense since the 1930s, which would usher in a more slugger-y type of game that would become a permanent feature in the years to come. While offensive levels bounced around over the next four decades, slugger-y types were always around in sufficient abundance to keep the flow of three-home games relatively constant. (That said, remember that by 1975, there were 50% more games being played per year; thus the per-game incidence of 3+ homer games is actually a good bit lower than what was the case in the 1950s.) 1987's "homer spike year" is unsurprisingly also the year when a new record for 3+ homer games is set.

The ante was upped in the 90s, as the offensive explosion began to center increasingly on the long ball. 1996 matched 1987 in 3+ homer games; the record was topped in 1999 and again in 2001 (with 22 incidences, matched in 2019, the all-time "homer zombie" year). The six-year total of 85 3+ home games from 1996-2001 seemed surreal at the time, but it was eclipsed in 2016-21 (93 such games) even with most of the 2020 season wiped out by the pandemic. 

There were 322 3+ homer games from 1901-1995; since 1996, there have been 325. Let's see now: 94 years versus 26 years (we'll keep that a whole number, adding our partial '23 to the 2020 "mini-season"). That's an acceleration rate for such games that grades out at over 350%. What was ultra-rare is now edging up on semi-commonplace.

And you can see that in the list of multiple 3-homer game guys (above right). While there are no truly shocking names in the upper reaches of this list, folks like Joe Carter, Larry Parrish and Steve Finley will likely raise some eyebrows. (And yes, we listed the guys by their first names: despite our reputation for churlishness, we're really a friendly "house of diatribe.") You may find it interesting to see Darnell Coles, George (Highpockets) Kelly, Jesse Winker, Jonny Gomes, Jose Valentin, Max Kepler, and Pinky freakin' Higgins (please pronounce his name by dropping the "H" in true Cockney fashion...) all with two 3+ HR games, while the magnificent Mike Trout has (gulp!) none, or the even more magnificent Mickey Mantle has but one. (Or...you might not give a snit, or a peach pit, or what-not: but know that in the Guerrero family, Vlad Jr. has bragging rights over his dad, who also never had a three-homer game.) And know that Mookie Betts is the odds-on favorite to own this list--and, in fact, will do so if he can ring up just one more 3 HR game.

Lots to chew on here, but we won't milk it for much more. There are some fascinating breakouts possible, though, thanks to the data inclusiveness provided by Forman et soeur (we salute another yeoman baseball femme, Katie Sharp, by formally changing our irreverent nickname for Baseball Reference to acknowledge her acumen). For example: the won-loss record for teams when one of their hitters has a 3+ HR game is 545-99 (.862). But you say that this doesn't add up to 647? By cracky, you're right! And it doesn't because there have been three 3-HR performances that occurred in tie games. Who are the fellas whose labors resulted in the event likened to a sisterly kiss? Two are in the Hall of Fame (Johnny Mize, Joe DiMaggio). The other is named Manny--sorry to say, though, that it's Manny Jimenez, not the "Manny being Manny" that it clearly should have been. 

Another breakout we enjoy is the one showing us what batting order position these guys were occupying when they had their 3+ HR games. Those numbers break down as you might expect (as shown at left), except possibly in one case--just how do you end up with a 3+ HR guy batting ninth, even in the proto-fascist age of the DH? And just who are these seven chimps who struck from ambush at the bottom of the batting order, anyway?

One of them happens to be (logically enough...) the only pitcher to hit three homers in a game--Jim Tobin, who did it on May 13th, 1942 against the Cubs. (Tobin, a genuinely good-hitting pitcher, hung on for the win for his Boston Braces thanks to his double-duty performance.) He was followed by future Amazin' Met Art Shamsky, who didn't even start the game on August 12, 1966, but slammed a pinch-hit homer batting for the pitcher midway through the game, was kept in the lineup and hit two more in what proved to a losing cause (the Reds, his team at the time, lost 14-11 in 13 innings). The next three to do it were all American Leaguers--Dale Sveum (Brewers, 1987), Trot Nixon (Red Sox, 1999) and Eddie Rosario (Twins, 2017). Eddie clearly triggered a streak of guys whose names end with vowels batting ninth and hitting three homers in a game, because he was followed in 2020 by Yankees' backup catcher Kyle Higashioka and White Sox backup catcher (sensing a trend, are you?) Seby Zavala in 2021. 

We could go on, but we won't. Oh, OK, it's true that Mookie Betts has the record for most 3 HR games by a leadoff batter--five of his six have been while batting in the #1 slot. But the ultimate trivia question for all this is clearly: has there ever been a single game where more than one player has hit 3+ HRs?

And the answer to that question is, tantalizingly: no. While there are several instances of 3+ HR games happening on the same day, there has (to date, at least) never been a game where two players each hit 3 or more homers. Recently, the Pirates (of all people) had 3 HR games from two different players on consecutive days (Bryan Reynolds and Michael Perez, on 6/29/2022 and 6/30/2022 respectively), but that's as close as anyone has come. We'll leave it to Sarah Langs and/or Katie Sharp to tell us how many times a 3+ HR game has been accompanied by some else hitting 2 HRs in the same game. 

So there you have it...and, as is so often the case, we owe it all to the Bambino. We'll circle back to this when the 714th 3+ HR game occurs...at the current rate, that should be sometime in 2029. Stay tuned...

Thursday, June 1, 2023

MAY IN A NUTSHELL

HERE's some quick-and-dirty data that gives you a high-level view of how May '23 panned out...

You've got the W-L records, the WPCT, the Pythagorean Winning Percentage (PWP)...and the percentage difference--blue Diff column in the center--between the two. (We did the counterintuitive thing with the color coding: black is bad luck, red is good luck. 

There are some sizable percentage differences when we're looking at results at the monthly level: the Pythagorean "luck" can represent a shift of three games either way during that time.

And there are ready explanations for those shifts that show up in the underlying results. For example, the Padres went 0-7 in one-run games during May--which will shift around your WPCT from your PWP without breaking a sweat. Similar issues befell the Blue Jays (1-5 in one-run games) and the Twins (2-8 in close games--those decided by two runs or less). 

The Royals continue to be among the strangest performers in MLB, losing slugfests and low-scoring games in tandem, winding up with three fewer wins than should have. 

On the other side of the ledger, the Tigers and Brewers dodged a number of bullets during May. Milwaukee worked hard to let their NL Central opponents back into the race, but it could have been even worse.

The HRH (Home Rnns Hit) vs. HRA (Home Runs Allowed ) data shows some warning signs for the Rays, who hit 61 HRs in April, but saw their HRH/HRA ratio slip back to virtually even-steven in May. That's what losing two front-line starting pitchers can do to you. Meanwhile, the A's pitchers remain "tater-tastic" (but not in a good way--and note that we reversed the color-coding for the homer differential, just to be confounding. (And we got the Royals' HR diff color-coded wrong; it should be black. Sorry, KC: you're strange enough without us helping.)

Two more 50+ HR months--the Yankees (53) and the Braves (51), which, added to the Rays, gives us three thus far in '23. There were a total of five such months in '22, as was also the case in '21--and in the abbreviated pandemic "season" in '20. That total--5+5+5+3 (18)--equals the number of 50+ HR months achieved by teams in 2019.