Monday, May 29, 2023

A PIE IN THE FACE OF PYTHAGORAS: BLENDED STANDINGS

NO. This is not a continuation of the broadside in the previous two posts. (But there is more to come from that: so, as we always say--stay tuned.)

NO. This is something completely different--and will likely be more maddening. 

But--YES. This is what we (often) do here. We question the monolith via a "termite art" application of analytical techniques (which only rarely involve sawing our lovely assistant in half).

So here we go (again). We'll be sneaking up to this one, even though the punch line is telegraphed in the blog post title. 

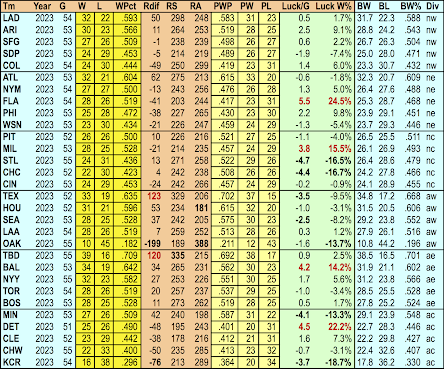
AT right you'll see the "standard standings" (minus the "games behind" column) that you'd see in either print or online media this morning--the basic record of MLB action up to and including games of 5/28/23.

Except that if you look at it closely, you'll see that it isn't quite right (at least not in the standard, accepted sense). There are a couple of teams that are not quite in the right place relative to their WPCT. 

That's because we "blended" the basic standings info with its analogue, the Pythagorean Winning Percentage (PWP), and resorted the unseen portion of the table according to such a "blended" approach. 

(In case you're unfamiliar with PWP--and if so, thank you, no, we have Jeni's Watermelon Taffy™ ice cream on hand, so feel free to hang onto that bumper crop of "deep-thump" that you rode in on--it's a formula using a ratio of runs scored/runs allowed to predict what a team's WPCT ought to be. Or what the Notorious RGB would have called "the meritocratic won-loss record.")

The shifts induced by this are not earth-shattering, but they might eventually wreak some havoc with the awarding of wild-card slots, which could create some consternation in some quarters. 

Before we show the results of the fully "blended" approach on their own terms, however, let's look at how Pythagorean "luck" is distributed in the more interconnected world of MLB (thanks in part to the still highly underreported change to the game in '23--the significant expansion of interleague play). To be frank, the "blended" approach here isn't as far as one could go with it: we could take this all the way to "pureed"--and don't push back too hard, or we will do just that!

SO here are the standings shown from the standpoint of Pythagorean luck. It's usually noted in the former of an integer: whole games of luck. But we are imps, and so we've added a later of precision that will permit us to eventually construct a standings system more incomprehensible that stock market derivatives. We then convert that figure into a percentage difference between a team's actual WPCT and its PWP, which gives you the figure in the column at far right ("Luck WPCT", or "Luck W%" as its shown above). And then we sort by that measure, which shows you the current state of luck as it's in play within MLB as of this morning. The Fish and the Tigers are getting away with something akin to murder, while the Cubs and the Royals are the dead bodies that the Clueless ones are trying to match to their murder weapon and murderer.

Liz Scott to El Tiante: "No one makes 'em like you do, Louie!"
AH, but if we would (for once) only stop here. But that's rarely if ever in the cards here, because the deck we've been handed is (rather like the world in the third decade of the twenty-first century) stuffed with jokers. So trust us when we tell you that our glee at continuing from tragedy to farce is actually rueful...very rueful. HA! 

To "blend" these stats (and, as noted, this is just a primitive attempt...) you simply need to average the actual WPCT and PWP. It's not an involved recipe (at least not yet, but be assured that we can make it just as convoluted as the Commonwealth--or the favorite drink of that smoky-voiced femme fatale in Dead Reckoning, the (Pedro) Ramos Gin Fizz

AND so we blend, and shake, blend and shake, shake, shake (like "the Fizz," we clearly need standings with a copious quantity of foam--to go with the mouth-foam that has regretfully overtaken our age, natch). When we do so, we wind up with non-integer "games" won/lost, which will anger purists and the terminally hip in roughly equal measure (be warned, though, that we could make that measure much more "precise"!). 

When we do all that, and stop with all the smark (a blended amalgam of "smart" and "snark"--exact proportions subject to change without notice...) we get the following look at a simple, first-cut pass at "blended" standings.

We've set it up by league/division (not wishing to be any more divisive than what we can get away with sans jail time...) so you can see how it coheres to the collision of real wins/losses and the "shoulda coulda woulda" of the Pythagorean alternative.

In this formulation, Pirate fans would be thrilled to see that their long-suffering club would make the post-season if the season came to an end on the day before Memorial Day, whereas Brewers fans would be up in arms, with some wanting to kidnap the governor (oops, sorry, that's Michigan, not Wisconsin). And Mariners' fans would be buoyed by the fact that the blended stats put their team into the post-season ahead of the Red Sox, due to the imperatives of the (so-called) "meritocratic won-loss record."

NOW there naturally are ways (as we've already noted) to make this a lot more complicated, and we've suggested many of them here in past postings where we've dared you to call up the men in the white coats and send them palpitating in our direction. We'll eventually (inevitably?) revisit some of those, and invent a few more, since it appears that 2023 is an entirely appropriate season for such flights of fustian fancy. As noted, the expansion of interleague play opens up several approaches that could exponentially increase the number of worms slithering from the can as we look for ways to loose more mere anarchy upon this little world, this emerald isle of baseball--in truth a cherished little island of hokum in a sea of fatuity, a tiny, mitigated meta-world that might be much more alluring if it would only substitute a funhouse mirror for its two-dimensional looking-glass.

OK. We're snapping our fingers now, and you must determine for yourselves if this now reality, or (merely) a post-hypnotic suggestion...

Sunday, May 28, 2023

UNBAKING THE PIE/2: THE INFILTRATION OF THE LOW-AVERAGE SLUGGER

WE continue with the arrows and slings (a great name for the eventual expansion franchise in Singapore, by the way) still being flung about in the little world of baseball related to batting average, isolated power, the infamous "Three True Outcomes," and the long bias in sabermetrics that has penetrated into baseball front offices in favor of the low-average slugger. 

As we've noted elsewhere, the underpinnings for all this have to do with two fundamentally incompatible impulses--the desire to create a model-based "field theory" for player value, and the fear that grips those who make their living in support of the baseball industry that it will regress and collapse if pitching continues to evolve faster than hitting, thus plunging the game back into the bottomed-out run scoring levels of 1968. 

Kudos to Jayson Stark for saying out loud what others merely tip-toe around: baseball was (and may still be, despite the rules changes) headed for a revisitation of 1968. Jayson focused on the decline of the single (a topic we broached several years ago) and how that was an ominous sign for the health of the game. In many ways, he actually undersold the problem (in 1968, with hitting at an all-time low, there were still 5.9 singles per game; the end of the offensive explosion and the descent into what we've been facing of late can be traced to the relentless decline in singles that first dropped back below six per game in 2009, slowly dropped below the 1968 value thereafter, and went into free-fall with the advent of the "launch angle follies" in 2016-17, until it flirted with the five-per-game barrier in 2020).

Much of this stems from a relentless sub-thread in sabermetrics that began as a way to evaluate a hitter's hidden offensive value, but that in the neo-sabe age (roughly 1996-2005) accelerated into an attack on batting average and outright advocacy of the low-average slugger. As always, we have the charts to show you just how this is so. 

THINK of this as the flip side of the chart in the previous post. Since the veneration/adulation of the low-average slugger has been so virulent over the past thirty years, we upped the ante just a bit with this data conglomeration, bumping up the quality level for low-average (.240 or less) hitters to 110% of league average (as measured by OPS+). 

What you see here is that such hitters barely existed until after WWII, and didn't become a regular feature of the baseball landscape until the strike zone change in 1963. Most of the players who fall into this category in the 1963-72 period are established sluggers whose batting averages were dragged down by the cumulative effects of the bigger strike zone, but their existence created a lingering effect that was a premonition of things to come. (The spikes on the chart echo Stark's admonition: the orange-colored label is 1968, the red-colored label is 2022. The spike in 1985 is due to a flukish drop in the overall category of .240- BA hitters, and an upswing of sluggery types who exceeded 110 OPS+ that year.)

This was interrupted (temporarily) by the offensive explosion, which bottomed out the low-average slugger for about fifteen years, until singles started to crash and batting averages began their serpentine descent toward .240. (All the while, of course, our "friend" the Tango Love Pie was decrying batting average as "meaningless". Despite his relentless attempt to dominate the conversation, it's clear that .240 became the Maginot Line for most of the insiders--and when the ping-pong effects of bloated bullpens and launch angle tactics collided in tandem with the rise of Trump, the game's "numerical moral compass" followed social trends and took a rapid nosedive.)

We can see how this fully manifests when we take the above chart and do what we did with the batting average chart in the previous post--looking at the running five year averages.

This chart makes it clear just how precipitous the climb was for the low-average slugger as a result of the strike zone change in 1963--it's nearly a vertical jump from 1960 to 1968. And note that the measures put into place as part of the massive expansion that occurred in 1969 took a few years to subside, bringing us into the speed-dominated game of the 1970s. The turnaround from that game takes place in 1985, is amped by a homer spike in 1987 which carries over the home run approach through the end of the decade. There's then a kind of stepwise decline in effective low-average sluggers, which is ratified and extended as a result of the offensive explosion, which raises batting averages to their highest level since the late 30s. It bottoms out in 2005--just at the point that "analytics" begins to impose itself from the neo-sabe offensive into a majority of baseball front offices. The running five-year average since then shows an almost unbroken rise of the effective .240- BA slugger, as the ideology took hold and slowly but surely eroded the historical norms. 

Again, Stark's admonition is affirmed: 2022's five-year average (representing 2018-22) is the highest in baseball history, pushing past the former peak set in 1968-70.

IT's important to note that this is not simply some inchoate historical "drift" we're talking about. It's a conscious (or, at least, "semi-conscious") advocacy for higher ISO relative to batting average--to the point where the former had become so detrimental to the latter than it created a game that was as sluggish as it was sluggerish. Baseball, as is the wont of many compromised institutions in America, is treating the symptoms by imposing a pitch clock--the statistical changes emerging from the clockification and the elimination of the shift have resulted in notably greater increases in doubles and homers and not in singles (up only 1% over the 2022 figure as of this morning). 

Bill James refuses to engage with the larger scale issues, apparently waiting for offense to dip closer to the 1963-72 "crater" before coming to grips with the situation. Mr. Love Pie is still banging the drum for "barrels" and decrying batting average as "meaningless." ISOBA (the ratio of isolated power to batting average) is at or near its highest level in baseball history. 

But this messy, messed-up game is now being played faster, and it's still a beautiful game despite its glaring flaws, so let's just look the other way as the baby steps being employed not-so-slowly turn sideways and lead us further into a two-dimensional world.

Bad idea, guys.

What the game needs: a lot more Luis Arraez and a lot less Tango Love Pie. 


Saturday, May 27, 2023

UNBAKING THE PIE/1: IS BATTING AVERAGE "MEANINGLESS"?

Caution: Tango Love Pies are more radioactive than ever...
YOU already know our position on the Tango Love Pie: don't swallow, and if you must chew, be ready to spit it out at a moments notice. The damage inflicted on baseball analysis by the Elon Musk of sabermetrics continues unabated by a talented but increasingly unhinged "data architect" who's been given far too much leeway to shape post-neo-sabe discourse and the date it uses to do so. We've been seeing it coming for more than a decade, and this two-part exposé will hopefully put more of that history into focus for you.

Beware the emboldened "barrelmeister" who remains unrepentant in making outrageous claims about traditional statistics in order to feather his own nested constructs--some of which are interesting and useful...but many more of these "advanced stats" are simply reconfigurations of existing metrics that don't advance our knowledge and understanding one iota. Beware such sweeping statements that fly from his fingers whenever there is some chemical reaction that occurs when someone challenges him...

...and one of these cropped up just recently, as he deemed batting average to be "meaningless" in conferring any form of useful information for analyst and fan alike. This is nothing more than a feverish throwback to the overheated "everything you know is wrong" stance that brought us the original neo-sabe movement (take a bow, Baseball Prospectus).

NOW please understand that we are not suggesting that batting average is the best possible statistic for determining the value of a hitter. We've been in the field (but only intermittently under house arrest) for thirty-odd years, which makes us slightly aware of the classical sabermetric work that created bedrock measures such as runs created and on-base plus slugging (and the park adjustments, such as they are, that have supplemented our ability to better discern the value of a hitter's performance).

What we're strenuously objecting to is the Love Pie's patently absurd claim that batting average is "meaningless." We've never seen him quantify this--which is odd, because that is the stock-in-trade of the "take no prisoners" approach that dominates post-neo "praxis" at this point in time. So we'll trot out a few charts that will put the lie to this claim, and we'll expose it as being part and parcel of an ideology that brought the game to a crisis point in the past five years--one that the powers within MLB have been forced to address with a series of rule changes that only band-aid the central ongoing dilemma within the structure of the game.

If we were to accept this hyperbolic claim, we'd be forced to presume that a hitter with a .300 batting average has only a random chance of being a "good" hitter. That there's something like a 50/50 chance that such a hitter is helping his team by, say, hitting at or above league average. 

It's a seductive thought that's floated around in the field for almost fifty years, ever since Bill James suggested it in the late 1970s. But James never suggested that batting average was "meaningless." (By the way, Bill plays some odd form of "rope-a-dope" with the Tango Love Pie over at Bill's site; it's an ongoing siege that is the sabermetric analogue to the Hundred Years War. It's not as interesting as it sounds, and you're not encouraged to plunk down your hard-earned money to witness it.)

SO now let's look at the first chart (at right, above) that we've generated to begin a pushback against the notion that batting average is "meaningless." What is this? It's an historical look at the yearly percentage of hitters with .300+ batting averages who've had an adjusted on base plus slugging (OPS+) of under 100 (in effect, under league average). The red line across the chart shows the overall historical percentage of .300+ BA hitters who've been less than average: that value is almost exactly five percent (5%).

Turning this around, that tells us that .300+ hitters are "good" or better hitters 95% of the time.

Hardly seems "meaningless," now, does it?

The yearly fluctuations on the chart as they move up and down over time are interesting, and could probably benefit from some interpretation. The high-water mark of below-average .300+ hitters occurs in the 1920-1940 time frame, when batting average was at its height (recall that the entire National League hit .303 in 1930). After WWII, there is a long period where .300+ hitters are all above league average (as represented by the cluster of scatter plot points shown at zero on the chart). With the offensive explosion that kicks in during the mid-1990s, however, we see a rise in the number of below-average .300 hitters. 

As pitching finally evolves in a way that brings the offensive explosion to an end, .300+ hitters decline sharply, and those who remain are primarily singles hitters: that combination causes the percentage of such hitters to rise. We can get a better look at how the phenomenon has played out by looking at a companion chart that shows the data in running five-year averages over time

This is a much more satisfying depiction of the prevailing trends regarding the frequency of "bad" .300+ hitters over the course of baseball history. What's important to note is that even at the zenith of .300+ hitters whose OPS+ was less than league-average (<100), that figure was only around 10-12%.

It should be clear to you now that hitters with .300+ BAs are, over the course of baseball history, 95% likely to be at least league-average. That is meaningful, even if it remains an incomplete picture of what comprises a hitter's value. We'll stop here now, and resume with a look at the other side of the coin--the ongoing ideology-based skirmish over low batting-average hitters with high isolated power--in our next installment.

Wednesday, May 24, 2023

WILL THE A's ESCAPE THE "BLUE GROUP"?

WE keep meaning to get back to the Expansionist Extravaganza, where bad teams get the chance to be good thanks to contextual sleight-of-hand; but we keep getting distracted by what one might call "the morbidly bad"...

...and that brings us back once again to the staggering Oakland A's, who after 50 games are tied for the worst start in major league history (10-40), arm in arm with the 1932 Boston Red Sox, who finished 43-111. The A's will be getting outsized attention from the media so long as they stay on pace to challenge the lowest seasonal winning percentage, so we can hope for their sake that they can pick up the pace (the organization has so much baggage at this point that saving them from one more soupçon of disgrace would provide a smidgeon of mercy for them). 

10-40 is not the worst 50-game span ever, though. There are many other 50-game spans in a season, and more yet if you overlap years (though that seems akin to A.J. Weberman going through Bob Dylan's garbage). When we look at the other 50-game spans within a single season (thanks to Forman et fils for expanding these tools...) we find that the worst such span occurred to another A's team, the 1916 Philadelphia A's, who had a stretch during that season where they went 4-46. 

BUT we don't want to dwell on the absolute worst, or keep kicking the A's while they're down. (The current team is being pilloried with variants of the "worst of" quotes, but none of those glib insiders actually saw the 1932 Red Sox or the 1916 A's, so they have no valid basis for comparison. No, all we can really do is contextualize.

And to do that, we've grabbed all the teams in history who had a 10-40 span during a single season and organized them into a master list (above right). There are 31 such teams since 1901 that make the list, including nine such teams in the past 25 years--and we're betting that you couldn't have named any of them prior to having seen the list. That's because the baseball media is fixated on beginnings and endings, and not nearly so much on the slog in between. (They wouldn't really be interested to know that the team here with the best overall final season record--the 1999 Cubs--were actually flirting with .500 in late July before literally falling off a cliff.)

What we can see from this list is that there's a common thread for the morbidly bad: they have extremely bad pitching. (Yes, you'll see the 1907 Cardinals with a 2.84 ERA--remember it was the Deadball Era, and the Cards scored 2.3 runs/game during their swan dive.) The aggregate ERA for the 31 teams--5.23--tells much of the tale; but most of these teams couldn't hit a lick, either. 

We separated the 31 teams into three groups and color-coded them. The "blue group" has in common the fact that they were unable to recover sufficiently to muster a .300 WPCT for the entire season. There are nine teams in the "blue group" (at least at present). 

The "green group" cleared the .300 hurdle, but could not get back above .350. There are fourteen teams in the "green group."

The "yellow group" exceeded .350, and three of the seven teams in this group managed to lose less than 100 games. 

If Ruiz can can get on-base enough, he might
actually lead the league in two categories...
Up at the top of the chart you'll see the 2023 A's, and their current team ERA of 6.93. That doesn't bode well for their ability to escape being the next member of the "blue group." (But beleaguered fans of the team might be distracted from the carnage by focusing on the exploits of rookie centerfielder Esteury Ruiz--that name is pronounced "S-tay-ur-ey"--who not only is leading the AL in steals, but is on track to be the first player since 1918 to have more hit-by-pitches than walks in a season. That doesn't say much for Ruiz' ability to take walks, of course, but somehow this extremely peculiar ultra-rarity feels like a perfect for the '23 team.)

SO mark it down now as  you'll see it--for the A's to escape "the blue group," they'll have to have a 39-73 record for the balance of the '23 season. That's a .348 WPCT: sounds like a piece of cake, right? They'll have to find some pitching, of course: the way their luck is running this year, that's a tall order--their best pitching prospect, Mason Miller, was shut down with an injury after just four starts. 

The A's bombed-out pitchers have been spared one indignity--they do not hold the record for the most home runs surrendered in a 50-game swoon. Their total of 85 is only second: the 1996 Detroit Tigers, playing in the heart of the offensive explosion, surrendered 88. But they're close enough that if they have another 10-40 run later in the year, they still have a shot at it. Hey, it's a world filled with cold comfort...stay tuned!

Friday, May 19, 2023

2023: YEPS EOY PROJECTION FOR RONALD ACUÑA JR.

It must be a Friday serendipity thing--both Joe the P. and Jayson Stark did the genuflect dance for Ronald Acuña Jr. in their mass missives today. We have less mass, but we'll do something with the uber-talented Braves sparkplug that neither of them bothered to do...

...which is to create a projection for what Acuña's stats will look like at the end of the season (or End Of Year, abbrev. EOY, which, as you can see, fits better in our title: so now you know--just in case you were wondering). 

How do we do that? We dust off our old YEPS tool (YEPS, or Year End Projection System, a fancy name for a spreadsheet-on-steroids we fashioned back before the turn of the century). 

There are a lot of these around now--you can probably go to Phangrafs (our spelling!) or Baseball Savonarola (we'll let you figure out just who/what that is...) and get something very, very similar. But we like our bathtub gin systems, which keep on ticking as the progenitors of such analogous oddly-named tools: ZIPS, Marcel the Monkey, and--our favorite--SWAG (Semi-Wild-Ass-Guess). 

But just a few words about how YEPS works. Take year-to-date (YTD) data, combine it with whatever form of prior career data you think is credible and/or relevant; proportionalize the combined totals, make adjustments for projected playing time, leaven the data a bit more by examining/applying various underlying trends (such things as relative BABIP--you know, batting average on balls in play), flip the switch and turn on the fake blender sounds (which will fade after about thirty seconds--if not, vacate the premises immediately...), and then--sneak a peak at the result.

And here they are...

Because we used Acuña's total career data for the projection, the BOS (that's balance of season,,,) numbers more strongly match his career total prior to 2023. (As of 2022, Acuña's career slash line was .277/.370/.517. YEPS, using career data that is maybe eight times as much as his current 2023 data sample, suggests that he'll produce a BOS slash line of .282/.366/.523. When that's translated into game stats--AB, R, H, D, T, HR, RBI, SB, CS, BB, SO--it all gets added to the YTD stats and you get the raw numbers you see in the second line of the chart. 

An argument can be made that we should de-emphasize Acuña's 2022 stats due to the aftereffects of the injuries he suffered in 2021. There are several ways to do that, with the simplest being to take it out of the calculation entirely. When we do that, Acuña's projections improve--he hits 40 HRs, strikes out more (oddly, his off-season in '22 was accompanied by a sizable reduction in his strikeout rate...), and his slash line adjusts upward to .303/.389/.562

SO those two calculations give you a range of result to look for when the 2023 season has concluded. The one we've shown above, with all pre-2023 career data, is a bit more conservative; the one that removes the 2022 off-year is more optimistic. We'll come back to this at the EOY to see if YEPS has a SBCIH of being right.

And if you don't know THAT acronym--well, just look to your left....

Tuesday, May 16, 2023

2023 UPDATE: LOCATING THE HR UPTICK...

Yes, homers are up in 2023. They're way ahead of the comparable pace from last year, due to the cold spring/cold start that we experienced. But they're a little less than halfway back to 2021 levels at this point; still safely below the insane peak experienced in 2019.

The question that continues to interest us--is how HRs fluctuate at major league ballparks. The Statcast cadre has developed a way to tell you whether a homer hit in a particular ballpark would or would not be a homer in other ballparks (a spiffy gimmick if we've ever seen one)...but they can't tell you why HR totals in each ballpark fluctuate. (This is what's known as assimilating oneself to the "hyper-smart dumbing down" of the media world.)

We don't have the answer to the question of "why," either, but we won't duck the fact that such is the case. Instead, we'll show you what's currently happening in the ballparks (in terms of HRs per nine innings) as compared to last year's levels. These are the levels for the entire 2022 season, not the portion up to May 15th (which is what we have for '23: after all, the rest of the games haven't been played yet!).

And what that data tells us is that it's the American League parks that are driving the uptick. In the chart at right we've color-coded the parks by league: yellow for AL, green for NL. We've sorted them in descending order of increase--which shifts into those parks where homers have decreased at the line drawn betwee San Diego's Petco Park and Atlanta's Truist Park.

If you count up the parks on both sides of the line, you'll see that there are 11 AL parks that have seen HR/9 averages increase, while 9 NL parks have also done so. That might look like a fairly even increase across the leagues...but you should notice that of the 13 parks with the greatest percentage increase in HR/9 thus far in '23, 10 of them are AL parks. 

Some tucking-in of distances seems to have shifted things in a big way at San Francisco's Oracle Park. Across the bay in Oakland, there were no dimension changes...just a sharp drop in starting pitcher quality on the woeful A's, which has brought their park closer to the league average from its usual HR suppressiveness.

We'd expect some convergence in this data as the season unfolds; next time we look at this (probably around the end of June), we'll retain the May 15th numbers for reference. Stay tuned--and keep swinging from the heels...

Sunday, May 14, 2023

QMAX: KIND OF BLUE (VIDA'S 1971 PEAK)

The recent passing of Vida Blue brought back memories of 1971, when he took baseball by storm. We didn't have the Quality Matrix (QMAX) back then, but it gives us some extra texture for what the 22-year-old lefty achieved in a season that deserves to be burned into our collective memory.

Blue's emergence set the tone for a five-year run by the Oakland A's as the best team in baseball, including three straight wins in the World Series (1972-74, a feat that remains exceedingly rare: the Yankees are the only other team that's managed to do it, with their runs in 1936-39, 1949-53, and 1998-2000). Vida would not dominate things the way that he did in 1971, but he was a dynamic presence throughout the A's tumultuous time at the top.

'71 was special, however. After Blue's striking teasers in his September 1970 return to the majors after being too quickly brought up to the big leagues in 1969 (a no-hitter and a one-hitter were sprinkled among his six starts), he shook off a shaky first start to assemble a 19-3 record over his next 24 starts, with seven shutouts, seventeen complete games, and 212 strikeouts in 209 IP.  His ERA at that point was 1.37.

QMAX can take us further into the details of that performance, with its look at combined hit prevention/walk prevention, adding a palpable sense of shape to the standard stats. 

Let's start by looking at those first 25 starts. The major QMAX "regions of interest" are shown in color-coded regions within its bi-directional matrix. The best games--where low hits/walks cluster--are found toward the upper left, while the "blown starts" can be seen (when they exist...) in the lower right. You'll notice the absolute paucity of such games in Blue's first 25 starts: his worst outing (his first of the year, on April 5) grades out as a "5, 7" on the matrix. It's not a "hit hard" game, which is the region in orange that spans the bottom two rows of the matrix. 

The yellow area surrounding the green square are games where pitchers are commonly successful; for that reason, we took to calling it "the success square" back in the early days of BBBA when QMAX was devised (even though, of course, it's not quite a square). That green square represents games where the pitcher and his team almost always win: on average, teams win just under 80% of these contests. As you can see, in Blue's first 25 starts in 1971, he had 88% of his games in the "success square" (22 of 25) and 44% in the "elite square" (our monicker for the region in green. Needless to say, these are exceptional numbers. 

Top hit prevention games were also at a highly elevated level in those first 25 starts. "Top hit prevention" is calculated by adding the top two performance rows together: these are the rows where hits are at least -4 or -2 relative to the number of innings pitched. Blue met those performance levels in 20 of his first 25 starts, or 80%--as you'll see in the "S12" stat shown in the summary data below the matrix chart. 

By this point in '71 (July 25th) Blue already had 212 IP (a figure exceeded by only one starting pitcher for the entire season in 2022). He would throw another 100 IP before the season came to an end. Those last 100 innings were not quite as impressive as what he'd achieved previously.

Now, they weren't bad--he didn't curl up into a ball. His arm didn't fall off. But 300+ IP is a monster load for anyone, at any time, and it's not surprising that his level of achievement would take a hit. 

And the QMAX chart/data shows us exactly where that occurred via the locations of the games within the matrix box, which shift away from the upper left. Blue nearly matched his percentage of "elite square" games in August-September of '71 (36% as opposed to 44% in his first 25 starts), but he became noticeably more hittable in the latter stages of the season. There's a 60% rise in his average QMAX "S" score (from a blistering 2.0 to a merely above-average 3.3). 

Vida Blue was extremely athletic even by the standards of professional sports, but he was not an overly large man (6'0", 185 lbs). His heavy workload in '71 quite probably impeded his ability to sustain the level of performance he demonstrated during that magical year. In his first 25 starts in '71, his H/9 was 5.4; in his last 14 starts, that jumped to 7.4--a figure that would be very close to his performance level for the next four years of the A's run as the best team in baseball. After that, he would decline further: for the balance of his career, his H/9 was 8.4. 

He did not suffer any career-interrupting injuries--he's not fodder for the "Pitcher Abuse Points" parade of "kiddie sabermetrics." But he's still a cautionary tale for how young pitchers have always needed to have their managers take the foot off the gas--especially when they're showing an exceptional level of achievement. Blue was a sensation in '71 the way that Mark Fidrych was five years later. As Doc Gooden was in 1984-85. All of these sensations wound up being less than what they might have been...some "more less" than others, of course. 

So we celebrate Blue's banner year with something of a heavy heart, knowing that the inherent dynamic of the game will tend to undermine its precocious pitching talent if it gets worked too much, too soon. Vida was luckier than many in that regard--his "try to hit my fastball" approach didn't wipe him out, it merely ground him down, slowly and inexorably. He won 209 games, after all. But he was never the same as he was in those magical four months in 1971. 

Friday, May 12, 2023

FURTHER ADVENTURES IN BADNESS...THE 39-GAME EDITION

One little chart and one GIANT chart for you tonight, to keep you off the streets...though we should all be keeping an eye on the A's players, who are enduring some of the cruelest (if not exactly unusual) punishments possible. Sure, they're in the big leagues, but the combination of ingredients--feckless owner, a front office that seems to have forgotten how to evaluate talent, and, of course, relentless inflation (the go-to excuse for all manner of blameologists...)--has transformed that into a curse stranger than any you'd encounter in a late-night zombie movie. 

We're now at game 39 of the Oakland death march, and they've moved into contention for being the worst team since the 1899 Cleveland Spiders. Their 8-31 record isn't the worst ever after 39 games, but they are within spitting distance. 

Since misery loves company, the chart at right shows you the miserable company that the poor A's are currently keeping. (Note the team's ERA, count to three, and recoil in horror.)

Looking at this chart made us morbidly curious to determine the very worst performance in a 39-game span in baseball history. (As you might suspect, those Spiders have the all-time record, going 1-38 late in their exceptionally miserable 1899 campaign filled with extenuating circumstances, but we're not going to count them just in case Lake Erie gets roiled up by our doing so and catches on fire again.)

No, give us the twentieth century, please (and who'd have thought we'd be yearning for its return just two decades into the twenty-first, eh?). As we'll see, the A's tie into this bitches' brew of badness, being the franchise that has gone down for the count in more sub-sections of baseball seasons than any other--their forlorn Philadelphia ancestors, chiseled into purgatory by Connie Mack, set the record for 39-game futility in 1916 by posting a 2-37 mark over a six-week period from June 28 to August 5. 

That sets them all alone at the bottom, chased closely by only themselves, with a 3-36 mark in an adjacent section of that frenetically forlorn 1916 season. Recently, however, the Arizona Diamondbacks had a horrific stretch (just two years ago, in 2021, from May 14 to June 25) where they went 4-35. 

And, depressing as that was (and still is, for that matter), it made us want to see just how often teams curl up and die for six weeks. We used 8-31 as the limit, since it's clearly a couple of notches below the worst season record posted from 1901 to now (the Boston Braves in 1935: 38-115, for a .238 WPCT). 

So, as you can see at left, we mapped the realms of badness by franchise from 1901 to now, and created a diagram (at left) that might induce natives of Philadelphia to consider slitting their wrists.

Why's that, you ask? It's because the two Philly franchises have combined for 56 instances where they've fallen into a deep, dark 39-game sinkhole. That's an enviable amount of catastrophe, to say the least! During the six pre-expansion decades, only Boston gave Philadelphia any kind of run for its money in this ongoing fall-down-go-boom floating crap game kerfuffle.

In the expansion era up to the fin de siecle of that now-strangely lamented twentieth century, the Mets took charge, with two eras of futility that were finally jettisoned in the early 80s. Other expansion clubs joined in, but they just didn't have the panache displayed by those Metsies. 

The A's and Phillies kept their hand in, of course, and there was the shocking collapse of the Orioles in the 1987-88 time frame (as you'll recall from the chart at the top of this post, it's the O's who've set the mark for worst 39-game record from the start of a season). The Detroit Tigers joined in toward the end of the century, and the Chicago Cubs bookended the millennium with two swoons in 1999 and 2000.

In 21st century, it's been the D-backs, the Tigers, the increasingly futile Kansas City Royals, the Orioles, and (temporarily, at least) the Astros who've done the quarter-season swan dive. And, of course, the A's have returned to the fold (get it?) with a vengeance thus far in '23.

But hope springs eternal. Tonight we get word that the A's got a three-run walk-off homer from Royals castoff Brent Rooker (his eleventh of the year) and pulled out their ninth win of the year, a 9-7 victory in ten innings. The A's have the makings of a passable offense--they're in the middle of the pack in homers--but their pitching is nothing more or less than deadly. In 2023, teams that allow seven runs in a game manage to win those games about 19% of the time (not to be obscure...that's a 15-64 record, with a WPCT of .190). 

SO--now you have a capsule history of baseball futility, a veritable anatomy of badness. And you know that the A's are following in their hallowed tradition, as represented by their ancestors taking int on the chin 37 out off 39 times just over a century ago. Don't say we never did anything for you!

Thursday, May 11, 2023

EXPANSIONIST EXTRAVAGANZA/2: ROUND 1 RESULTS

Back down the page at BBB you'll find the "set-up" for the Expansionist Extravaganza, our impish "NCAA-style" tournament with full-season face-offs between the fourteen first-year expansion teams and the two worst Dodger/Yankee teams in the Expansion Era. (Our thanks to "Magnum" and "Higgins" for their tireless efforts in support of this semi-inspired lunacy.)

And so, now, here is the overview of the Round 1 results--where eight teams survive (only to be foreced to walk over ground glass again...), and the other eight get to go home. 

As you can see, the top eight seeded teams all advanced to the second round. 

We've provided some of the seasonal details relevant to the specific match-ups, including the Pythagorean Winning Percentage (PWP) so that you can see how that matches up with the "actual" results. In the case of the '93 Rockies/'69 Pilots--the closest of the eight contests--it shows that Seattle actually outscored Colorado over the course of their season-length skirmish, but they seem to have been let down by their bullpen, which contributed to their sub-standard performance in one-run games. 

For the most part, home field advantage was a dominant feature in the first round: the winning teams combined for a .619 WPCT at home. Reflexive Yankee haters may be heartened, however, by that club's lackluster home performance against a pesky but outgunned Blue Jay squad. 

Little Albie dwarfed by Marilyn Monroe
June 1, 1962, at Dodger Stadium...
Some individual performances stood out in these "match-ups of the mediocre." The Expos' wild-ass pitchers threatened to break the all-time record for walks allowed by their pitchers (808, by a pennant-winning team no less, the 1949 New York Yankees), finally winding up just shy at 793. That afforded the Dodgers' Brett Butler a chance to have the career season of all career seasons, drawing 166 (!) walks, scoring 177 (!!) runs, hitting .355 and fashioning a .488 OBP. (If you're reading this, Brett, you can pay us later.)

Similarly, the clustered crapola on the '62 Mets staff bestowed many of the same benefits upon Albie Pearson (the 5'5" mighty mite who was quickly dubbed "The Littlest Angel" when he was taken by Los Angeles in the expansion draft). Pearson matched Butler's .488 OBP, drawing 161 walks, scoring 137 times as the Angels coasted into the second round.

On the pitching side of the ledger, teams matched up against weak-hitting opponents would often benefit from superior performances from hurlers who'd been a good bit less successful against the opponents they played against in the real-life year. This only stands to reason, of course, but it's interesting to see how much better some of these folks did. For example, the 32-year-old Tampa Bay Devil Rays rookie Rolando Arrojo, who had a tremendous season in the actual 1998 (14-12, 3.56, 133 ERA+), absolutely dominated the '93 Marlins (16-6, 2.95). And the Rays' bullpen was particularly efficient in that match-up as well, most notably Roberto Hernandez (27 saves, 2.72 ERA)... and that man for whom we've always had a strange yen, Esteban Yan (9-1, 2.45 ERA). 

While the Yankees were a bit sluggish, playing under their Pythagorean Projection by about five games, that couldn't be said for Roberto Kelly, whose performance was probably the greatest "upward outlier" of all the deviations generated by these match-ups. Kelly hit .382 with 259 hits and 41 doubles--almost 100 points higher in BA than in his actual 1992.

Let's wrap up for now; we'll get into greater detail as the rounds progress toward the ultimate showdown. For now, the dreaded Dodger/Yankee "final match-up" scenario is still in play. Here's what our "NCAA diagram" shows us for Round Two: stay tuned!

Tuesday, May 9, 2023

INTERLEAGUE PLAY 2023: UPDATE AS OF 5/8

Expanded interleague play is still under the radar in the midst of all the other changes implemented in MLB in 2023. As always, BBB--like nature--abhors a vacuum...

...so here are the team records as they stand as of yesterday's games. 

First, let's reiterate that the irregularity of matchups in interleague play will continue to have some impact on how the divisional races play out. Exactly how that happens is difficult to nail down just yet, but we expect to have more clarity for you on this by the time we get to the second half of the season.

Note that two teams--the Dodgers and the Padres--still have yet to play an interleague game in '23, while five teams (Phillies, Pirates, Giants, Mariners and Nationals) have played 14 or more games against the other league (40%+ of their schedule). 

An interesting contrast is in sight regarding two teams that have struggled in recent years: the Tigers and the Nationals. Detroit is looking a bit better than expected thus far in '23, but much of that might be explained by the fact that the early schedule has brought them a series of weak interleague opponents: thus far in '23, Detroit has a 7-1 record in such games. Meanwhile, the Nationals have played eleven of their fourteen games against strong interleague opponents, and lost eight of them. (As you might surmise from this, they're playing much better against their own league.)

Note also that the Pirates, who were off to a blazing start, have hit a wall in the past two weeks, partly because they hit a portion of their schedule where they were facing strong interleague opponents. 

Looking at the bottom line data (at the bottom of the data...), we see that the AL has opened a six-game lead in 2023's interleague sweepstakes. Some of that, however, may be due to the fact that the league as a whole has yet to play strong interleague opponents. AL teams have only played 41 games against strong NL teams, while NL teams have played 61 games against strong AL teams. Looking at the two leagues' record against weaker opponents, note that their winning percentages in such games are virtually identical (.536 for AL, .532 for NL).

We'll be staying on this all season long...stay tuned.

Monday, May 8, 2023

THE HOTTEST 35-GAME "SCALDS" EVER...

Following up on our ramblin' Rays update, we turn our attention (thanks to the data features available at baseball-reference.com) to the best won-loss records over any 35-game span at any point within a single season. 

Who won the most games over a 35-game period? And which of the teams with "high-performance spans" (as shown in the chart at right) went on to win the World Series?

That's all available at a glance, but let's go through it a bit. The 1906 Cubs, with the best WPCT of any team in any season, make sense as the top dogs here, with their 33-2 run in the heart of the second half. (They managed not to win the World Series, however).

The Cubs also held the second-best "scald" from a different span point in the 1906 season--32-3--a skein that was matched in 2017 by the Cleveland Indians (driven, of course, by their remarkable 22-game winning streak). The 2017 Tribe could not get past the New York Yankees in the post-season, however.

[Note that we are only showing one instance of any number of possible ongoing instances of these "scalds," in order to keep the list relatively manageable.]

In the group of teams with a 31-4 "scald," we have the 2017 Indians again, who were the second team that season to do so--the first being the Los Angeles Dodgers, who got red-hot during June and July. The Dodgers made it to the World Series but lost to the Houston Astros. Other 31-4 skeins belong to the 2001 Oakland A's, the first team we encounter who didn't win their division, and the 1977 Kansas City Royals, who lost in the playoffs to the New York Yankees. We have to go back to 1947 before we find a 31-4 team that also won the World Series--not surprisingly, perhaps, the Yankees, who also did the same in 1941. Rounding out the list are those 1906 Cubs.

The 1912 Giants, who lost the World Series to the Red Sox, show up at 30-4, with one tie in their 35-game stretch. Their skein occurred early in the season, which is relatively rare occurrence amongst these teams: only ten of the teams on the list had a "scald" that began in April or May.

In the 30-5 group, we find the 2017 Indians and Dodgers again, who are supplemented by three other 21st-century teams that got "scald-y": the 2022 Dodgers, en route to 111 wins; the 2013 Dodgers, who were actually under .500 when their "scald" began; and the 2002 Oakland A's, with their hot spell centered around a 20-game winning streak. None of these teams made it to the World Series.

Hotted-up teams in our inverted look at the twentieth century are dominated by the presence of the New York Yankees, who have 30-5 "scalds" in 1998, 1953, 1947, 1941, 1939, and 1928--and winning the World Series in all of those seasons. The Giants and the Cardinals are also on the list when we travel back to WWII and beyond, each with three appearances: only St. Louis actually won a World Series in any of those years, however (1942 and 1944).

In more recent times (but still nearly forty years ago at this point), we have the Detroit Tigers in 1984, with their singular start (30-5 here, but extending out to 35-5) bookended by a smashing World Series win. 

So we'll see how it goes for the Rays as 2023 progresses. Their 28-7 start puts them just inside  the top 100 of "scalds," with many more teams that either missed the World Series (or missed the post-season entirely: that includes teams such as the 2005 Indians, the 2005 A's, and the 1978 Pirates--such misses are rare, but they do occur.) With the World Series much harder to reach in post-expansion times, we should note that of the eight "scald" teams (30-5 or better...) that have appeared since divisional play started in 1969, only three of them have made it all the way to the Fall Classic ('84 DET, '98 NYY, 2017 LAD), with two of them (Tigers and Yankees) winning. Stay tuned...

Sunday, May 7, 2023

AFTER 35: RAREFIED RAYS

The Tampa Bay Rays rallied from a 5-0 deficit against the New York Yankees earlier today, raising their 2023 early-season won-loss record to 28-7. 

That's a winning percentage of .800 after 35 games--a little more than 20% of the season.

We're moving past the "early" segment of "early-season"...so let's see what a hot 35-game start means relative to the future fate of those teams with the hottest "hot starts."

And the chart (at left) suggests that the Rays have truly reached rarefied territory.

Of the 33 teams on the list with at least a 26-9 record in their first 35 games, 23 of them won pennants. Which means that 70% of the team with such starts to their seasons have played in the World Series.

13 of those teams (39%) have won the World Series.

Additionally, four more teams (the ones marked with a "d" on the chart) made it into the post-season.

The only teams with such scalding starts who didn't make the post-season one way or another are: the 1911 Detroit Tigers, the 1912 Chicago White Sox, the 1941 St. Louis Cardinals, the 1952 New York Giants, the 1972 New York Mets, and the 2002 Boston Red Sox. 

Turning those numbers around, that means that 82% of all teams with at least a 26-9 start in their first 35 games have made it into the post-season.

We'll follow up in the next post with a list of the hottest 35-game spans at any point during a single season. The question: how many teams have done better that the 30-5 season starts by the '84 Tigers and the 1902 Pirates?


Saturday, May 6, 2023

THE "EXPANSIONIST EXTRAVAGANA"/1: THE SET-UP

Ariel meets Bogie in..."Another Guy's Dream."
From the "Necronexic Noir" series...
SO...what do we do around here when we're not ripping someone a new one, or scouring through the stats that even the SDCNs ignore? (And how many of you recognize that long-ago/far-away acronym?)

Of course, the answer is that we do a lot of things, and some of you know all about them, while others simply continue to avert their eyes, looking for a more congenial train wreck. (If we were half our age, we'd simply leave you guys hanging indefinitely while we took a crack at chasing down the eminently wooable Ariel Rosario, but some free spirits are simply destined to be free...)

ALL foreplay aside, we've been known to mess around with sim baseball when we're not overly distracted by what used to be called "pulchritude." And why not: it keeps us off the streets...but that public service aside, there is much to be gleaned, informative and otherwise, from some semi-systematic simulation (above and beyond some serial, simultaneous masochism, that is). The stories we could tell...

...but we'll confine ourselves to just one for now. It's a doozy, howevah. How it evolved is lost in a shroud, or trapped in an almost-empty gin bottle, or spattered on the window like a murdered moth. 

BLAME it on March madness....except it actually commenced before the dribbling maniacs took over the airwaves. For some reason the NCAA bracketing thing had attached itself to the remnants of our brain like a clothes hanger inserted into each ear lobe to take advantage of the limitless space within that temptingly adjacent skull...

So, as we wore our shirt over our head, and with a stiff mid-winter breeze blowing like Illinois Jacquet at three AM in a jacked-up juke joint, it came to us: let's get down with badness. Not the kind that conveys a sense of imperturbability amidst peril, mind you...but literal, everyday, corn-fed, bottom-of-the-barrel incompetence

And...thus: an NCAA-style tourney amongst some of the worst teams in baseball history--the first-year expansion clubs who took it on the chin so that the game could evolve into a mega-industry with TV deals larger than the GDPs of half the countries in the world (and, of course, "ghost runners"--the skeleton key to all post-Keynesian economic theory). 

So, to wax nostalgic (and what is baseball but a waxy form of nostalgia?), we were stoked (man!) by such a heterodox notion. And with the help of our friends Higgins and Magnum (no, not those two--ours are a couple of nom de plume collaborators who are still willing to humor us...) we started to set up a protracted battle even more epic than the current weekend series between the winsomely woeful Oakland A's and the morbidly midwest Kansas City Royals. 

BUT there was a hitch. (A hitch without a McGuffin, even.) As we got to counting on our left toe after using both hands, we realized that there are only fourteen expansion clubs (even though there are, of course, several metric tons worth of teams who've played like an expansion club). We needed sixteen teams to construct an NCAA-style "bracket" that could lead us to an ersatz champion...the best of the worst. 

And then it came to us: who better to join the 1961 Senators and Angels, the 1962 Mets and Colt .45s (later the Astros), the 1969 Royals, Pilots (now Brewers), Padres and Expos (now Nationals), the 1977 Blue Jays and Mariners, the 1993 Rockies and Marlins, and the 1998 (Devil) Rays and Diamondbacks than the two marquee franchises in baseball history

Yes, even the Yankees and the Dodgers have had a few seasons in which they approximated the won-loss record of a first-year expansion team. Their presence in this wacky competition was guaranteed to add an essential tension to the proceedings--namely, would they simply run through the competition like soft butter and wind up facing each other in the final 162-game showdown. (Wouldn't that be just ghastly?)

That's right, it's a 162-game showdown. Remember what we said earlier about "serial, simultaneous masochism": we set out to play full seasons' worth of competition between these teams, giving those Mets a chance to play someone bad enough for long enough that they might actually wind up with less than 100 losses (for those who've forgotten, the '62 incarnation of the Mets lost 120 games, and did so pretty much without breaking a sweat). 

To set it up, however, we had to find a way to create seedings for the teams in a manner analogous to what's done for March madness. And that's what you see in the figure (above at left), where we captured the salient details in first-year expansion clubs and the Yankee/Dodger "fall-down-go-boom" seasons. We took each team's actual WPCT and averaged it against their Pythagorean Win Percentage (PWP), using that average (in the column marked AW) to create a seeding for the tournament. 

AND it came to pass in those days that it became the "Expansionist Extravaganza", aka "The Feckless Fourteen Plus Two" (or...anything else you can come up with in the next ten seconds). As you can see, the 1992 Dodgers and 1990 Yankees are the #3 and #4 seeds in the tournament, and as we devised the tournament seeding chart (at right), it's clear that there was a clear and present danger the two "Tiffany franchise" ringers might end up meeting for all the marbles (OK, some of the marbles--no one here is playing with a full set of marbles!)

That's where we're going to leave things right now, with the eight first-round showdowns ready to roll. (Truth told, they've already rolled: yes, that's right...we're just going to drag this out for as long as we can.) But play along with us: check out the teams at the bb-ref pages linked above, and familiarize yourself with their preternaturally overmatched personnel. Try to envision which two teams will meet in that dark orange box in order to claim the title of "best of the worst." And try to figure out what player or players will emerge as the "superstars" of this beleaguered league of the woeful countenance, this round-robin of wretchedness, this...

Aw, hell--stay tuned!

Friday, May 5, 2023

WHAT JOE THE POSER DOESN'T WANT TO KNOW...

Shameless hucksters spread false love and insidiously filtered information with glad-handing impunity: it's the rotten underside of "all-American apple pie," congealing into ever-more involuted, rat-maze-infused entrails of manipulation. 

Cults of personality are the bane of our post-postmodern world, and while Joe Posnanski's is certainly more benign than what America is contending with as we struggle to survive the first quarter of what might yet be the last century of man on earth, he is not helping anyone with his increasingly invasive blather. 

There's just so much of it...in the age of AI anxiety, one has to wonder if Joe the Poser has been cloned in a secret Silicon Valley experiment that jumped the shark, escaped the lab and is now devouring virtual acreage at a rate startlingly accelerated beyond even the sinister encroachment witnessed in Invasion of the Body Snatchers. (Joe Pod-nanski??)

Joe's increasingly breathless, tone-deaf accounts of baseball leave all of us on the brink of asphyxiation. One can only hope that this monstrously prodigious burst of enervating energy is the precursor of an explosion that will scatter his turbid texts permanently to the winds. 

There is not a single fact that he cannot somehow twist into something monstrous: His most recent (earlier today) is immensely instructive: the Midwestern man tilting windmills at two of baseball's storied franchises, revealing the true, utterly predictable inner bile of those who use sports to absolve the chasms in their own psyche. Joe takes the time today to revel in the current misfortunes of the New York Yankees and the St. Louis Cardinals, finding (as always) a slender thread with which to permit himself to overcook his verbal stew and sling the pot around the room, leaving a mess for someone else to clean up. 

He "doesn't want to know" that the two teams might have been in last place at the same time in some other past; he feels justified in reveling in a moment of vengeful glee, to mark it as one more manifestation of his reptile brain taking over everything (just as he's doing with his increasingly insipid, self-indulgent, trumpeted-to-the-skies version of the Hall of Fame--just another book project, no doubt). 

Some time ago, before all of this ego metastasized, Joe might have been interested to know that, in fact, there was at least one previous time when the Cardinals and the Yankees were in last place on the same day. As it turns out, 2023 happens to be the 50th anniversary year of this event...

...which occurred on April 25, 1973--a season where the two teams had strangely parallel roller-coaster paths in their journeys to nowhere.

On that day, the Yanks were playing a day game at home (the old Yankee Stadium) against the Chicago White Sox. (These were the Sox with Dick Allen, who'd won the MVP award the year before: they were expected to give the World Champion Oakland A's a real run for their money in '73.) On this day, knuckle-balling lefty Wilbur Wood shut them out on five hits, in one of 21 complete games he'd post for the year, out of a total of 48 games started. (Yes, indeed...how things have changed.) Carlos May's first-inning homer off Mel Stottlemyre was the only run that the Pale Hose needed; the final score was 3-0.

The Yankees fell to 6-10 for the year, which landed them in sixth (last) place in the AL East that day.

That evening, in St. Louis, the Cardinals hosted the Los Angeles Dodgers--off to a middling start, but with a lineup of young hitters that would soon become a catalyst for a team that would win four pennants over the next nine seasons. The Cards were off to their worst start in recent memory, but they were optimistic that Scipio Spinks, the young pitcher they'd acquired as part of the previous season's fire sale, would build on his promising rookie campaign and turn into the next Bob Gibson.

The hijinks were sadly short-lived for 
Scipio Spinks (and his monkey...)
On this night, Spinks did a more-than-passable imitation of Gibson--the younger version who was still a bit wild: Scipio walked five, but allowed just two hits over seven innings, weakening only the fourth, when the Dodgers scored twice to tie up the game. Spinks homered off Al Downing in the fifth and left the game with a 3-2 lead...

...only to see the game tied up again in the top of the eighth when Cards' shortstop Ray Busse made his third error of the game, allowing the tying run to score. The game went into extra-innings (no "ghost runner" in or out of sight back in those days...) and the Dodgers scored against former teammate Alan Foster in the eleventh, eventually winning the game, 5-3. 

The Cardinals continued scraping the bottom with a startling 2-13 record, en route to an ignominious 5-20 start for the '73 season, still their worst ever.

BUT strange turnabouts abound in baseball, and both the Yankees and the Cardinals would find themselves in first place in their divisions by August 1st. 

As you might imagine, the Yankees got there first, due to the fact that their record after 25 games in '73 was 11-14, not 5-20! For much of the first half, the AL East was a tightly jumbled race: on May 23rd, when the Yankees finally reached .500 (20-20), they also (briefly) moved into a tie for first place. June would be their best month--a 19-10 record, and by early July they had a four-game lead.

However--the Baltimore Orioles would stage a return to form in the second half of the '73 season, leaving the Yankees and all of their other AL East opponents in the dust. Anchored by the ace pitching of Jim Palmer and Mike Cuellar (a combined 22-7 mark in the second half), the O's took control and won in a cakewalk (whatever that means...). The Yanks' 2-9 West Coast road trip late in August erased any doubt: they would finish 80-82 on the year. (The next season things got stranger still: they found themselves playing in Shea Stadium.)

THE Cardinals took longer to get well, not reaching .500 until late June (33-33). After a 3-15 record in April, they went 53-33 from May 1st to the end of July, and by August 6th they were eleven games over .500 with a five-game lead in (what was then) the NL East. 

But then they lost 11 out of 12 (mirroring a stretch in May where they'd done the exact opposite...). And they kept losing throughout the month, in large part because Bob Gibson had suffered a knee injury while running the bases early in August and looked to be out for the year. They regrouped briefly at the end of the month, holding on to first place in a division where all the teams seemed to be playing in a daze. The Cards built their lead back up to three games on September 5th--and then promptly lost nine of their next ten. 

It was a maddening season to watch. Long-time friend and colleague Brock Hanke remembers it as being the strangest phenomenon he'd ever seen. He also recalled a bizarre incident that fit in with the entire "aura" of the year. 

"It was Bake McBride's first major-league at bat," he recalls (late July). "McBride was a legendary speedster in the minors: he had the nickname of 'The Fulton Flash.' He hit a grounder to the right of the second baseman, who fielded it, turned, and threw to first noticeably late--but the ump, not believing what he'd just seen, called McBride out. I don't think he'd ever seen anyone run that fast."

And that summed up the strange 1973 season in St. Louis, when there was not nearly so much discussion of what has since become known as "The Cardinal Way" (and has become sand in the armpits for many). Gibson would return in the final week of the season, pitch heroically on a not-quite healed cartilage injury, and pick up a win that kept the Cards' minuscule pennant-race chances alive. (In retrospect, it was ill-advised: Gibson aggravated the injury by doing so, and was 14-23 for the rest of his career). St. Louis won their last five games of the '73 season--and, after all that up-and-down motion, finished 81-81. (They were beaten out by the New York Mets, who'd been in last place on Labor Day.)

ALL of this is a reminder that snapshots are just that--only a single image, a tiny fleck of data from which to make sweeping, oracular pronouncements. The "post neo-sabe" world of baseball media, led by ever-more unbridled practitioners on all levels of "discourse" (Joe the P. and the man we call the Tango Love Pie), simply continue to escalate their efforts to control the vertical and the horizontal of baseball "wisdom" via tools and a new brand of increasingly aberrant stats that have been consistently oversold. In Joe's case, his need to hit folks when they're down belies what is relentlessly advertised as a "sunny disposition"--a not-so-brilliant disguise that has long since worn thin but that all too many are simply letting slide. 

What happens to the Yankees and the Cardinals in 2023 is not (yet) cast in stone--even Joe hedges his bets about the former, merely taking advantage of what he'd like to pass off as a "singular" moment in time to take a potshot. (His hatred for the Cardinals, though, seems very specific and harkens back to one of Bill James' worst texts--the one about the 1985 World Series, a scurrilous "intra-Missouri takedown.") Sadly, he demonstrates just as much arrogance and puffery in doing so than those franchises (and fans) to whom he's expressing his schadenfreude. Here at BBB, we are (in)famously more like Mikie in the Life cereal ad: we "hate" everything reflexively, and then look for the slender pathways of redemption that might yet emerge. The strange journeys of the Yankees and Cardinals fifty years ago were easily forgotten--but they remind us that there is so much more left to be (re)discovered, and that, eventually, even the most obnoxious blowhards will one day simply stop breathing...